The StatQuest Illustrated Guide to Statistics
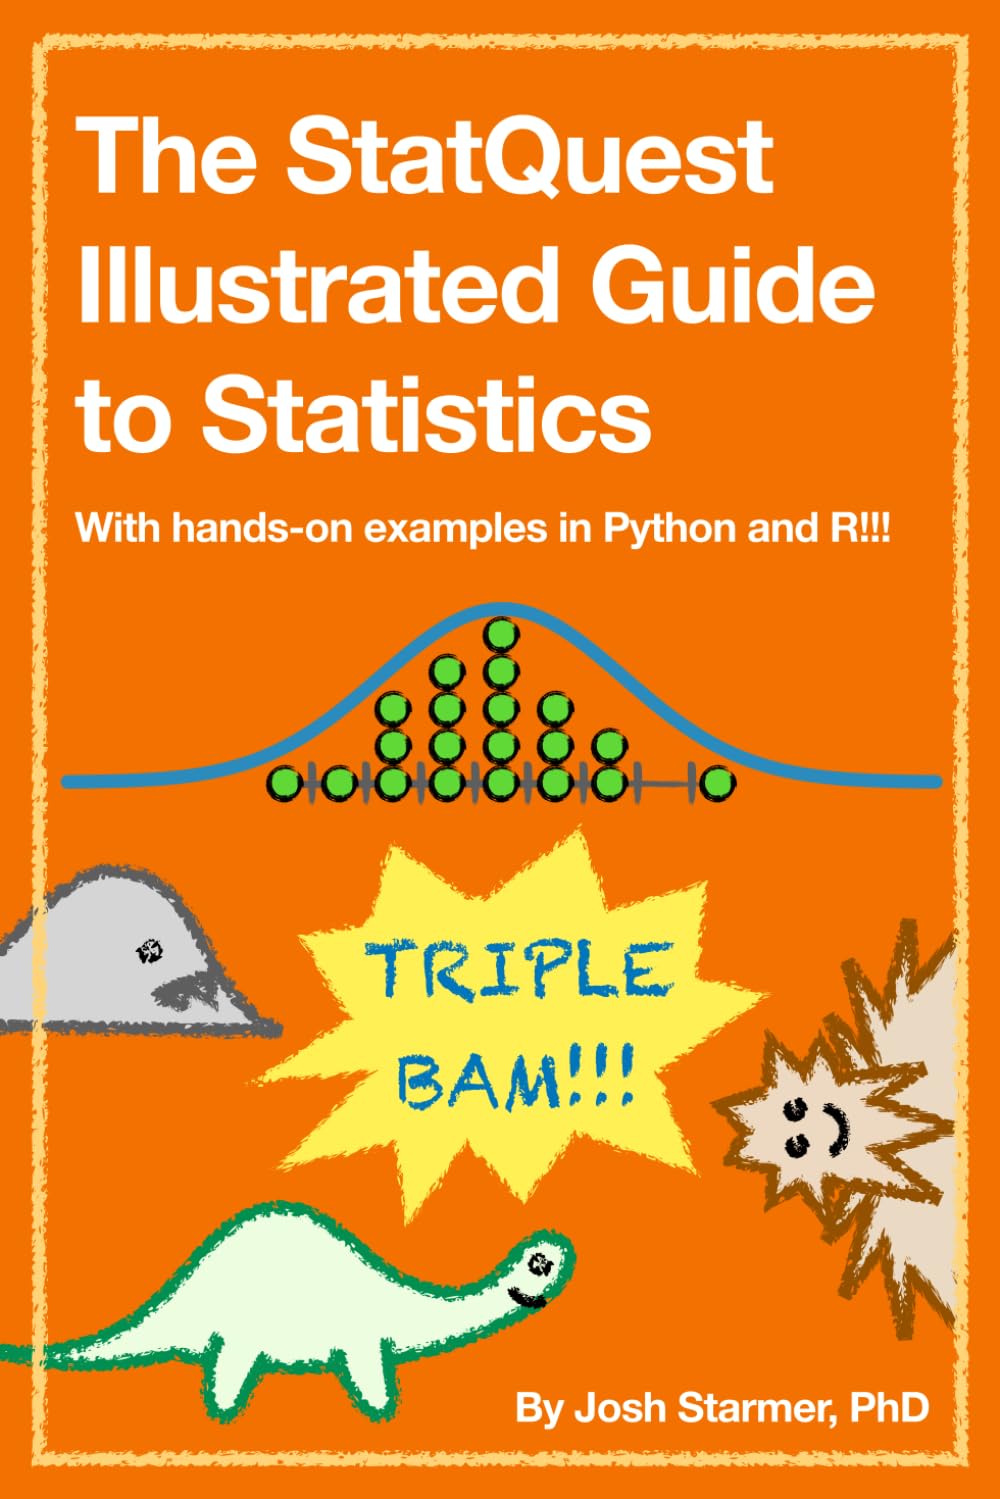
This note summarizes my impressions of Josh Starmer’s book “The StatQuest Illustrated Guide to Statistics”, along with a takeaway of my own.

Summary
The first time I came across the t-test was in a stats course during my MBA, about 25 years ago. The instructor was so uninspiring that I walked away with formulas and no intuition. This book is the opposite of that course.
Josh Starmer, the creator of the StatQuest YouTube channel, guides the reader through introductory statistics with the help of a cartoon Sasquatch. The drawings are not decoration. Every idea is introduced as a picture first, and only then turned into a calculation.
The book’s best move is to show that many tests usually taught as separate recipes are the same idea in different clothes. The t-test, ANOVA and ANCOVA all come down to asking whether a fancier model explains the data much better than a simpler one. Once that clicks, there is very little left to memorize.
The book also leans on the computer. Instead of looking up a table, you can shuffle the data many times and see how often chance alone produces a result as striking as the one you observed. For me, that was the moment the purpose of these tests finally made sense.
The chapter on power is a good example of the style. Rather than handing over a calculator, it explains why two groups that overlap heavily need many more samples than two groups that are clearly apart. The chapter on p-value pitfalls is equally practical: running many tests, quietly dropping the ones that disappoint, and collecting more data until the result turns significant.
Each chapter comes with hands-on tutorials in R and Python, so the curious reader can go from picture to code without a detour through heavy math.
Takeaway
This book can be read by a variety of personas: a newbie to the stats world, someone who understands the math but is looking for intuition, someone who has years of experience in the field but wants to revisit some of the basic stats and the intuition around them, and the list goes on. The highlight of the book is its visual approach to explaining concepts and formulae. Worth reading at least once.