Elements of Hindustani Classical Music
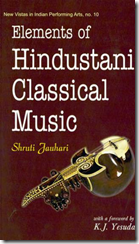
This book is written by Shruti Jauhari, a noted Hindustani Classical Singer and a disciple of K.J.Yesudas. The book is an accessible introduction to the various elements of Hindustani Classical Music. To read a language, you need to know the alphabets and the grammar associated with it. In the same way, to listen to Hindustani music, you need to have a basic knowledge of Svar,Raag and Taal One often comes across terms like bandish, gharana, alap, vilambit , taal, etc in the context of Hindustani Music. Unless one has some understanding of these terms, it is difficult to be a discerning listener.




 .
.
![image_thumb[1]](/2012/02/04/advanced-trading-feb-2012/images/6a00d83453b94569e20168e6ab4e47970c-pi "image_thumb[1]")