How Students Learn Statistics

This is a nice article that talks about students’ impediments in learning statistics. The article gives a laundry list of recommendations to improve the state of statistical pedagogy at college-level courses.

The basic goals for any instructor should be to impart the following ideas:

  1. The idea of variability of data and summary statistics.

  2. Normal distributions are useful models though they are seldom perfect fits.

  3. The usefulness of sample characteristics (and inference made using these measures) depends critically on how sampling is conducted.

Mindless Statistics

The paper titled, Mindless Statistics , by Gerd Gigerenzer, makes a case for banishing the mindless “null ritual” from statistics. In this blog post, I will summarize the main points of the paper.

The author starts off by emphasizing the importance of developing a statistical toolbox. Indeed statistics is a rich subject that can be enjoyed by thinking through a given problem and applying the right kind of tools to get a deeper understanding of the problem. One should approach statistics with a bike mechanic mindset. A bike mechanic is not addicted to one tool. He constantly keeps shuffling his tool box by adding new tools or cleaning up old tools or throwing away useless tools etc. Far from this mindset, the statistics education system imparts a formula oriented thinking amongst many students. Instead of developing a statistical or probabilistic thinking in a student, most of the courses focus on a few formulae and teach them null hypothesis testing.

A Multi-Language Computing Environment for Literate programming and Reproducible research

The paper titled, A Multi-Language Computing Environment for Literate programming and Reproducible research , gives an introduction to org-mode. In order to communicate research work to others, it is often important to mix prose and code in same document. There are many tools out there that do the job. However org-mode is one such tool that is useful for literate programming as well as reproducible-research. Be it a research environment or a pedagogical environment, the need for mixing code and prose is always present. This paper talks about Org-mode that is probably one of the most powerful tools prose and code from many languages.

Active Documents with Org-mode

The paper titled, ”Active Documents with Org-mode ”, gives a concise introduction to the way org-mode can be used for reproducible research. In one single document, Linux shell commands, Python code and R code are all used for analyzing base-ball statistics. Org-mode is used to produce one comprehensive documents that details all the various steps in the analysis.

The following visual from the paper gives an overview of the org-mode document :

Should vs. Must

Link : What to Do at the Crossroads of Should and Must ?

There are two paths in life: Should and Must. We arrive at this crossroads over and over again. And each time, we get to choose. Should is how others want us to show up in the world — how we’re supposed to think, what we ought to say, what we should or shouldn’t do. When we choose Should the journey is smooth, the risk is small

Martingales in Survival Analysis

The paper titled, History of Application of Martingales in Survival Analysis , provides a nice narrative of the various scientists, mathematicians, events and concepts behind the wide-spread usage of martingales in Survival analysis.

There are two major takeaways from this paper. One is of course the time line of all the developments in the field of survival analysis. The second takeaway from this paper is a good intuitive understanding of martingales + martingale stochastic integrals and their practical application in getting to asymptotic properties of many estimators. Survival analysis is one field where theoretical developments and practical applications have gone hand-in-hand. The paper, mirroring the developments in the field, gives a balanced view of the way martingales played a crucial role in all the developments.

Survival Analysis – A Self-Learning Text

book_cover_sa_self

As the title suggests, this book is truly a self-learning text. There is minimal math in the book, even though the subject essentially is about estimating functions(survival, hazard, cumulative hazard). I think the highlight of the book is its unique layout. Each page is divided in to two parts, the left hand side of the page runs like a pitch, whereas the right hand side of the page runs like a commentary to the pitch. Every aspect of estimation and inference is explained in plain simple English. Obviously one cannot expect to learn the math behind the subject. In any case, I guess the target audience for this book comprises those who would like to understand survival analysis, run the model using some software packages and interpret the output. So, in that sense, the book is spot on. The book is 700 pages long and so all said and done, this is not a book that can be read in one or two sittings. Even thought the content is easily understood, I think it takes a while to get used the various terms, assumptions for the whole gamut of models one comes across in survival analysis. Needless to say this is a beginner’s book. If one has to understand the actual math behind the estimation and inference of various functions, then this book will equip a curious reader with a 10,000 ft. view of the subject, which in turn can be very helpful in motivating oneself to slog through the math.
Biased vs. Unbiased

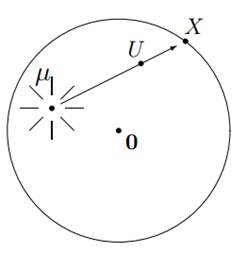
The following is a nice example from Michael Hardy that shows how excessive focus on unbiasedness of an estimator leads to nonsense results :

image

A light source is at an unknown location µ somewhere in the unit disk D. A dart thrown at the disk strikes some random location U in the disk, casting a shadow at a point X on the boundary. The random variable U is uniformly distributed in the disk, i.e., the probability that it is within any particular region is proportional to the area of the region. The boundary is a translucent screen, so that an observer located outside of the disk can see the location X of the shadow, but cannot see where either the light source or the opaque object is. Given only that information—the location X of the shadow—the location µ of the light source must be guessed. What’s your estimate of µ, given X ?

100 crores fraud at NSE

A whistleblower( someone working in a hedge fund at Singapore) alleges that NSE had indulged in market manipulation to the tune of 100 crores over a period of three years. What are the allegations against NSE, Omnesys and others?

  • Tick by Tick data was disseminated via TCP/IP instead of UDP for three years and there was no load balancer in place.This meant that the person who could connect to the server that had the least load and be first in the queue was at an advantage. The information on server loads was leaked out.
  • The info of the exact start of time of the primary and backup servers was leaked out to Omnesys and an unnamed individual
  • Massive Multi legged IOC orders were executed by those who were privy to the primary and backup server start times
  • NSE provides certain special privileges to hedge funds and HFT shops based out in Singapore, who then use to game the system

Link to the whistleblower’s detailed note

Birthing Music

Making beautiful and powerful music is a physical act - pulling, scraping, beating, and straining wood, steel and muscles. Music is not made. It is wrought. Sounds are wrung from wood and steel, Fingers pull metal. Horsehair scrapes gut. And out of the pulling, beating, scraping and straining comes that most intangible, that most beautiful and powerful of things . . . music.

Statistics Done Wrong

cover

This book is vastly different from the books that try to warn us against incorrect statistical arguments present in media and other mundane places. Instead of targeting newspaper articles, politicians, journalists who make errors in their reasoning, the author investigates research papers, where one assumes that scientists and researchers make flawless arguments, at least from stats point of view. The author points a few statistical errors, even in the pop science book, “How to lie with statistics?’’. This book takes the reader through the kind of statistics that one comes across in research papers and shows various types of flawed arguments. The flaws could arise because of several reasons such as eagerness to publish a new finding without thoroughly vetting the findings, not enough sample size, not enough statistical power in the test, inference from multiple comparisons etc. The tone of the author isn’t deprecatory. Instead he explains the errors in simple words. There is minimal math in the book and the writing makes the concepts abundantly clear even to a statistics novice. That in itself should serve as a good motivation for a wider audience to go over this 130 page book.

Desiderata

Via Zenpencils

Go placidly amid the noise and haste, and remember what peace there may be in silence.

As far as possible, without surrender, be on good terms with all persons. Speak your truth quietly and clearly; and listen to others, even to the dull and the ignorant, they too have their story. Avoid loud and aggressive persons, they are vexations to the spirit.

If you compare yourself with others, you may become vain and bitter; for always there will be greater and lesser persons than yourself. Enjoy your achievements as well as your plans. Keep interested in your own career, however humble; it is a real possession in the changing fortunes of time.

Quote for the day

When physicists do mathematics, they don’t say they’re doing “number science”. They’re doing math. If you’re analyzing data, you’re doing statistics. You can call it data science or informatics or analytics or whatever, but it’s still statistics.

- Karl Broman

MCMC for Item Response Models

I was looking to code Metropolis-within-Gibbs sampler for a specific model and in that process, stumbled on to an online supplement for a work-in-progress book,``Handbook of Modern Item Response Theory’’.  The following document summarizes the main points from chapter-15 of the book. The document also contains WinBUGS code to estimate the parameters of 2PL model.

Building Metropolis Hastings sampler from scratch

Quote for the day

“You never quit on your music. No matter what happens. Cuz anytime something bad happens to you, that’s the one place you can escape to and just let it go. I learned it the hard way”

- August Rush

Bayesian Model for Capture-Recapture Data

Modeling Capture-Recapture Data via Bayes involves specifying the likelihood of the survival + encounter probabilities and the priors on the parameters. A natural extension of a plain vanilla model is to make the survival probabilities time dependent. The paper titled, “Autoregressive models for capture–recapture data: A Bayesian approach ”, is about modeling the survival probabilities by taking various covariates such as time and random effects.

The following document contains a brief summary of the paper :

AR(2) estimation in WinBUGS and JAGS

AR(2) estimation in Bayes from first principles involves writing an M-H sampler as full conditional distributions for some of the parameters does not belong to any standard form. However softwares like WinBUGS and JAGS make the life easy for a modeler. The following document contains some basic code to do Bayesian inference for AR(2) process using WinBUGS and JAGS

AR(2) parameter estimation in WinBUGS and JAGS

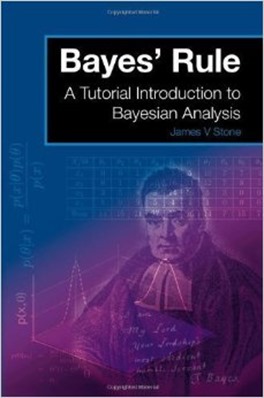
Bayes’ Rule - A Tutorial Introduction to Bayesian Analysis : Book Review

book_cover

The book serves a nice intro to Bayes theory for an absolute newbie. There is minimal math in the book. Whatever little math that’s mentioned, is accompanied by figures and text so that a newbie to this subject “gets” the basic philosophy of Bayesian inference. The book is a short one spanning 150 odd pages that can be read in a couple of hours.  The introductory chapter of the book comprises few examples that repeat the key idea of Bayes. The author says that he has deliberately chosen this approach so that a reader does not miss the core idea of the Bayesian inference which is,

Technique to learn something new

Via boingboing :

Someone stole $90 million from a company I was involved in. I’m a poor judge of people. The company collapsed.

Some things I can’t learn. I tend to like people too much.

So it’s hard for me to be a good judge of people, no matter how much I try. So I find other people who are good at judging people and I ask them to help me.

Don’t force yourself to learn something if you don’t want to or it’s not a natural talent.

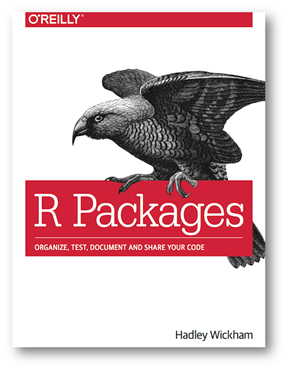
R Packages : Book Review

image

Link : A brief summary of the book

image  Takeaway

“Write your code as though you are releasing it as a package” - This kind of thinking forces one to standardize directory structure, abandon adhoc scripts and instead code well thought out functions, and finally leverage the devtools functionality to write efficient, extensible and shareable code.

Trade Classification : A Bayesian Approach

The paper titled, “Discerning Information from Trade Data ” by David Easley, Marcos Lopez de Prado, Maureen O’Hara, gives a Bayesian framework for trade classification. The most popular method for classifying a trade as buy/sell is via “tick test”. The authors introduced Bulk Volume Classification (BVC) and empirically test the performance of it vis-à-vis tick test. In this post, I will briefly summarize the paper :

**Introduction
**With the advent of HFT, the markets have changed completely. Order cancellations and modifications have shot up as compared to yesteryears. Execution side algos chop orders and send it across to the exchange and hence it is order flow rather than individual orders that relate to trade motivation. Also with strategies such as “persistent bidder”, where the aggressive trader uses limit orders to trade, the vital link between informed traders and aggressive traders is lost. All these implications severely undermine algos that infer trade direction from a single trade.

Inferring Trade Direction Revisited

I had to read this paper again after ~1.5 years as I had forgotten the basic idea behind the classification. My understanding, this time was far better than the previous encounter. In this post, I will list down a few points form the paper

One can think of three ways to classify trades as “buy” or “sell” trades.

  1. Tick test : Compare the current trade price to the previous trade price

Spectral density of point processes

The paper titled,”Spectra of some self-exciting and mutually exciting point processes ”, is one of the most widely cited papers in marked point process literature. I guess this was the first paper that explored the complete covariance density function of point processes, and in particular, self exciting and mutually exciting processes. In the time series literature, the covariance of  a stationary process at various lags have special meaning. If you consider the generating function of the covariance at various lags and evaluate at a specific complex exponential, you arrive at population spectrum of the time series. The population spectrum thus obtained has several interesting applications.

Bitcoin Trade Arrival Modeling

The following note is motivated by the blog post, “Bitcoin Trade Arrival as Self-Exciting Process ”. Since the author has shared the data and code, I wanted to check some of the numbers from the post. The author uses “ptproc” which is deprecated library and has been removed from CRAN. In this note I have used the trades dataset from the author’s github directory and fit a self-exciting model to the trade arrivals. My analysis shows that the data does not fit Hawkes process, contradicting the blog post conclusion. In fact when I looked at the code at github, I found the task of adding random milliseconds missing. The sanitized dataset used after randomized addition is double the size of the original trades data. Clearly there is something wrong with the data.

Mini Projects on Hawkes processes

I have stumbled on to a few mini-projects that revolve around fitting univariate and bivariate Hawkes processes. In this post, I will briefly summarize the write ups :

High Frequency Trade Prediction with Bivariate Hawkes Process

The authors starts with a SDE for intensity process and formulate its solution as a univariate Hawkes process. A visual depiction of self-excited intensity process is obtained via simulation. The time change theorem is stated and a QQ plot of the compensator is shown to follow an exponential inter-arrival distribution. The same thing is repeated for bivariate mutually exciting Hawkes process. Expressions for the log-likelihood of the bivariate Hawkes process is stated and MLE results are shown on a simulated dataset so that the estimates can be compared to the true values. TAQ database is used to obtain tick data for DELL, YHOO and ORCL stock. Since the data is discretized in whole seconds, the timestamps that share the same second are uniformly redistributed in the overlapping second. Using Lee and Ready tick algo, the trades are categorized as buy or sell trades. Bivariate Hawkes process are fit to the buy and sell trades. This model is put to test on a strategy where 1) stocks are longed if buy intensity > 8 times sell intensity, 2) stocks are shorted if the ratio drops below 1/8.

Modeling Civilian Deaths in Iraq

The paper titled, “Self-Exciting Point Process Models of Civilian Deaths in Iraq ”, deals with fitting point processes to civilian deaths from March 2003 to December 2007. In this post, I will summarize main points from the paper

Firstly, What is “Operation Iraqi Freedom” ? Here’s a wiki blurb

The 2003 invasion of Iraq lasted from 19 March to 1 May 2003 and signaled the start of the conflict that later came to be known as the Iraq War, which was dubbed Operation Iraqi Freedom by the United States. The invasion consisted of 21 days of major combat operations, in which a combined force of troops from the United States, the United Kingdom, Australia and Poland invaded Iraq and deposed the Ba’athist government of Saddam Hussein. The invasion phase consisted primarily of a conventionally fought war which concluded with the capture of the Iraqi capital of Baghdad by American forces.

Modeling Trades-Through in a Limit Order Book

The paper, written by Ioane Muni Toke and Fabrizio Pomponio, titled, Modeling Trades-Through in a Limit Order Book Using Hawkes Processes , uses Hawkes process to examine microstructure behavior.

This paper uses Multivariate Hawkes process to model trades-through. The best thing about this paper is that the authors have made the dataset available for the readers so that they can work through the numbers
and get a feel of model inference. The dataset is available at dataverse . I have used the dataset from the repository, crunched numbers and have managed to replicate most of the results in the paper. I hope this feature of “Reproducible Research” becomes more widespread and authors start disseminating their datasets along with their papers. In this blog post, I will summarize the main points of the paper.

Rise of Quants - Again

Via TP (Techcrunch ) :

Today, Silicon Valley is the hottest place for quants to be – though people with this skill set are often referred to now as data scientists. A similar confluence of factors — data, technology and algorithms — has combined to enable a new class of transformational opportunities. These opportunities are not limited to just financial services; they are showing up in every sector of the economy.

ACD–Modeling Irregular Spaced Transaction Data

The following document contains a brief summary of the paper titled, “Autoregressive Conditional Duration - A New Model for Irregularly Spaced Transaction Data ” by Engle and Russell.

ACD-Summary

image Takeaway :

The paper models the duration between transactions.With the ease of availability of HF data, there needs to be a model that captures irregularly spaced timestamps. It is obvious that neither a standard Poisson process nor a non-homogeneous Poisson process is going to be a good fit. The conditional intensity function has to depend on the past history of transaction times. The authors formulate a particular form for the conditional intensity function and explain the clustering phenomenon as well as some well known market microstructure patterns.

FBI report on “Flash crash” Fraudster

Gregory LaBerta, a Special Agent at FBI has come up with a 35 page document that gives a detailed description of the trades executed by Navinder Singh Sarao, who is accused of playing a major role in the “Flash crash” on May 6, 2010.

I am surprised with this new finding as it comes out of nowhere and that too after 5 looong years. For the last 5  years, there has been a debate; the majority view being that the whole HFT community played a big role in the “Flash crash”. One could see harsh criticism on the HFT guys by academicians, low+mid frequency traders, regulators etc. Michael Lewis book on HFT created furor in the entire investing community. Now after all the noise,  FBI thinks that it is ONE guy ( who sits at his parents house with a couple of terminals + toxic trading strategies) IS mainly responsible for “Flash crash”.  Is it believable? Can one guy really destabilize the highly liquid E-minis market ? We will know based on the outcome of his trial.

Simulating univariate Hawkes’ by thinning

The paper, written by Yosihiko Ogata, titled, ``On Lewis Simulation Method for Point Process ", gives a detailed procedure to simulate univariate and multivariate point processes. The following document contains the algo and necessary R code for simulating univariate Hawkes’ self exciting process. The good thing about this algo is that is based on “thinning” and hence it is not a computationally expensive task.

Simulation of univariate Hawkes via Thinning

MLE of Hawkes' self-exciting point processes

T.Ozaki’s paper titled, “Maximum likelihood estimation of Hawkes’ self-exciting point processes ”, deals with the univariate Hawkes’ process. The paper gives a detailed method to obtain the ML estimates of the process. In order to verify the ML estimates, the author simulates the process and compares the true vs. estimated parameters. I found a typo in one of the expressions for the gradient. In any case, R provides nlm function, that computes the gradient and hessian numerically. So, if one chooses to, one can slog out the expressions for gradient and hessian, and then feed in to nlm , else, you can allow the function to do the job numerically.

Play @ Bandra

image

Today, I had a chance to see a play, “Kuchh Bhi Ho Sakta Hai”. It is a one person act and in this case, it is Anupam Kher, who narrates his own life story in a way that keeps the audience entertaining right through. There was not a single dull moment in the entire play. Thoroughly entertaining 2 hour act.

Simulating NHPP in R

Homogeneous Poisson process (HPP) is easy to simulate in R as there are standard functions built in to the language. Simulating Non-Homogeneous Poisson process(NHPP) take a little bit of effort. There are many algorithms out there and I guess the best amongst them is based on “thinning”. The math behind thinning is explained in the paper,”Simulation of NonHomogeneous Poisson Process  by Thinning ”. The paper, while explaining the method, also gives a laundry list of methods that can be used to simulate NHPP.

Virtu goes Public

Via Barrons

The world has a way of making what was once controversial safe for consumption. For evidence, look no further than Lou Reed’s upcoming induction into the Rock and Roll Hall of Fame. The same holds true for Virtu Financial , which successfully completed its initial public offering last week.

That Virtu (ticker: VIRT) is now a publicly traded company is a marvel, considering the failure of its first attempt about a year ago. That coincided with the release of Michael Lewis’ book Flash Boys, which argued that high-frequency traders rigged the market in their favor. With so much venom being spewed in its direction, Virtu pulled its IPO.

Résumé virtues & Eulogy virtues

Via The Moral Bucket List

If you live for external achievement, years pass and the deepest parts of you go unexplored and unstructured. You lack a moral vocabulary. It is easy to slip into a self-satisfied moral mediocrity. You grade yourself on a forgiving curve. You figure as long as you are not obviously hurting anybody and people seem to like you, you must be O.K. But you live with an unconscious boredom, separated from the deepest meaning of life and the highest moral joys. Gradually, a humiliating gap opens between your actual self and your desired self, between you and those incandescent souls you sometimes meet.

Order Flow, Transaction Clock, and Normality of Asset Returns

The paper written by Thierry Ane and Helyette Geman, titled, “Order Flow, Transaction Clock, and Normality of Asset Returns ” explores the concept of changing the “calendar time” of the asset return process to recover normality.

The idea that, “Calendar time might not be an appropriate measure of time in the financial markets”, has been explored in the past. Mandelbrot in 1963 published a paper that introduced a class of stable processes that could recover normality. The stable processes were nothing but Brownian motion processes subordinated by another stable process. In 1973, Clark published a paper in which he introduced a subordinator based on trading volume. However the presence of these two classic papers has not spawned further research. The investigation of specific subordinators that might recover asset return normality has been sparse in the finance literature

Why is Poisson process, a very special process

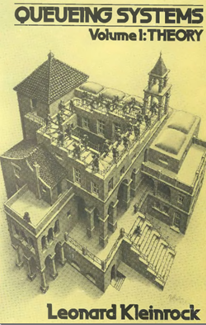
Queueing theory is an area where one can find superb applications of various stochastic processes. Here is an adapted visual from Kleinrock that gives a 10,000 ft. view of the various processes. The visual below, at once, explains the reason for Poisson process being so special. It is a process that is an intersection of Semi Markov process, Markov process, Random Walk process, Renewal process and Pure Birth process.

It is in the sweet spot, so to speak, of six popular stochastic processes.

Quote for the day

Does anything in nature despair except man? An animal with a foot caught in a trap does not seem to despair. It is too busy trying to survive. It is all closed in, to a kind of still, intense waiting. Is this a key? Keep busy with survival. Imitate the trees. Learn to lose in order to recover, and remember that nothing stays the same for long, not even pain, psychic pain. Sit it out. Let it all pass. Let it go.

Quote for the day

“Music is a proud, temperamental mistress. Give her the time and attention she deserves, and she is yours. Slight her and there will come a day when you call and she will not answer. So I began sleeping less to give her the time she needed.”

― Patrick Rothfusss

The need for a Bayesian wrapper

Via Frequentist inference only seems easy

Bayesian methods are not necessarily more painful that frequentist procedures. The Bayesian estimation procedure requires more from the user (the priors) and has an expensive and complicated convolution step to use the data to relate the priors to the posteriors (unless you are lucky enough to have something like the theory of conjugate distributions to hide this step). The frequentist estimation procedure seems to be as simple as “copy over your empirical observation as your estimate.” That is unless you have significant hidden state, constraints or discreteness (not the same as having priors). When you actually have to justify the frequentist inference steps (versus just benefiting from them) you find you have to at least imaging submitting every possible inference you could make as a set of variables and picking a minimax solution optimizing expected square-error over the unknown quantities while staying in the linear flat of unbiased solutions (itself a complicated check).