Knitr
Yihui Xie
, the author of Knitr
package mentions my book review on the package demo site

- A book review on RPubs by RK
I had rewritten my review as an Rmd and had posted on RPubs for others to read.
Yihui Xie
, the author of Knitr
package mentions my book review on the package demo site
I had rewritten my review as an Rmd and had posted on RPubs for others to read.
This paper mentions a mechanism to clean high frequency data of outliers. The setting is NYSE TAQ(Trades and Quotes data) and many initial filters(data cleaning) applied are specific to NYSE. However the mechanism for removing outliers that is mentioned by is market agnostic. The key idea behind the method is to choose k neighbor prices + a fudge factor gamma, and compute a trimmed mean and standard deviation of the k neighboring prices. If the price point moves away from the trimmed mean of these k neighbor prices by 3 standard deviations plus a fudge factor, categorize the observation as an outlier else include it in one’s calculation.
highfrequency is an R package that can be used to 1) clean and aggregate high frequency data, 2) compute realized volatility measures 3) compute liquidity measures. The package is an improved version of two other R packages, RTAQ and realized. The vignette for thepackage explains two models, HAR and HEAVY models. HAR models rely on jump modeling and one needs to have a decent idea of Levy processes to appreciate the HAR variants. There are also a ton of realized volatility measures that can be obtained from the package functions. The following is the list :

The distinguishing feature of state space time series models is that observations are regarded as made up of distinct components such as trend, seasonal, regression elements and disturbance terms, each of which is modeled separately. These models for the components are put together to form a single model called a state space model which provides the basis for analysis. The book is primarily aimed at applied statisticians and
econometricians. Not much of math background is needed to go through the book,at least the first part of the book. State space time series analysis began with the path breaking paper of Kalman and early developments of the subject took place in the field of engineering. The term state space comes form engineering. Statisticians and econometricians tend to stick to the same terminology.
**
Your home is whatever your love more than yourself.**
Via TP - Data Scientist Interviews
Parham Aarabi, Founder of Modi Face
ModiFace technology simulates skin-care and cosmetics products on user photos. So, a skin care product that reduces dark spots, or a shiny lipstick, or a glittery eyeshadow … we specialize in making custom simulation effects for all facial products. This is us as a core
Pick problems that in your view truly matter. Too often, we find ourselves pursuing goals that deep down we don’t believe in, and this will only lead to failure or unappreciated success. Pick problems that in your view truly matter. Too often, we find ourselves pursuing goals that deep down we don’t believe in, and this will only lead to failure or unappreciated success.

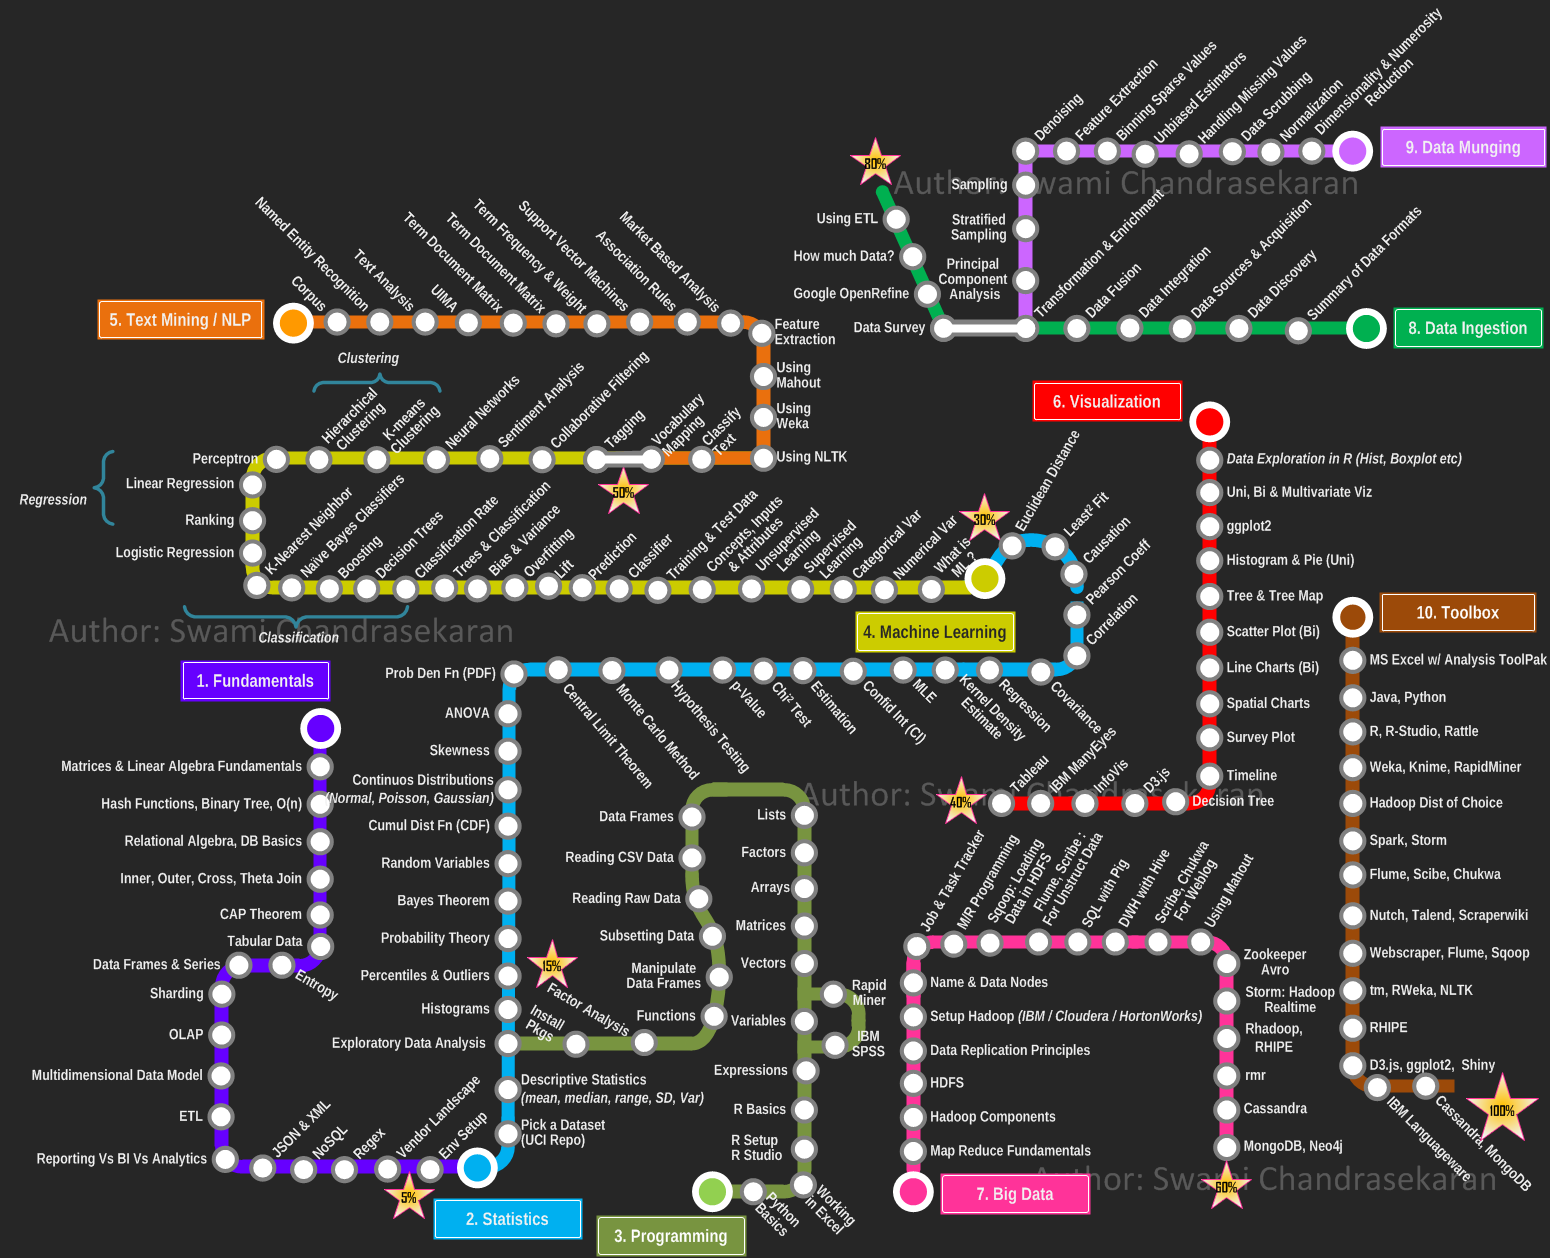
Data Science is a very loose word and can mean different things in different situations. However one thing is certain, the principles used in tacking problems are from diverse fields. Drew Conway has this Venn diagram on his blog :

In such a diverse field one does not know where to start and how to start. Someone has made a nice Metromap too. All said and done, this is a field that has considerable entry barriers. One needs to spend at least a few years to get the basics right to understand some basic algorithms.
This paper gives the details of a useful algorithm that speeds up the simulation of state vectors from a state space model. The algorithm runs very quick as compared to other methods. I ran the algorithm for a simple local level model inference via Gibbs sampling and found the speed to be considerably faster than other Forward Filter Backward Sampling algorithms. For a more generic Bayesian inference, this algorithm will no doubt cut the computation time significantly.
A lovely article written by Shiv Visvanathan :
My father loved to walk. It was his great ritual, his idea of prayer and work. Every morning at four, the house would echo with the thump of his shoes, the tumbler of coffee, as he hurried out. My dachshund, a wise ten-year-old would wait impatiently, grumbling melodramatically about any delay. Whoever talked of walking a dog never understood man or beast. Walking was an act of companionship, a way of saying hello to the world, sniffing, grumbling, greeting every morsel, smell, object, sight and human being. To add to the excitement, my neighbour’s dog, an oversized young Doberman called Marcus would join them. It was a strange troop — a dachshund striding in front, Doberman casually behind, each attentive to every signal from my father. As the years went by, the Dachshund got older and more tired but he refused to miss his walk. My father would carry Fritz around the lake and release him just as he reached home so he could stride the last lap with dignity, the Lord of all he surveyed.
When the going gets tough, the tough lower their standards!
- Dr. Sanjoy Mahajan (Street Fighting Math)
Classification trees fail miserably in some cases and in such situations, bumping might be a good method. A stylized example of bumping is as follows : Imagine that there are two covariates x1 and x2 and the true class labels dependend on XORing the two covariates. The orange labels represent one class and blue labels represent another class.
If you run any sort of plain vanilla classification algorithm that does greedy binary splits, the algo will fail. For example if you run a classification tree on this, the results would look something like this (almost all the observations get assigned to a specific class) :

Link : Detailed Summary of the book
 Takeaway:
dlm package in R is one of the best resources out there in the open source community that can be used for DLM inference. The fact that one of the authors is also the contributors to the package has made this book apt for practitioners. However the book is best understood after having a working knowledge of Bayesian inference. By understanding and thinking in State space framework, a modeler gets many more options to model univariate or multivariate time series data. This book does an amazing job in explaining the nuts and bolts of State space models in Bayesian setting.
Taleb and Goldstein asked the following question to about 87 people that included portfolio managers, Ivy league graduates and investment professionals :
A stock (or a fund) has an average return of 0%. It moves on average 1% a day in absolute value; the average up move is 1% and the average down move is 1%. It does not mean that all up moves are 1%–some are .6%, others 1.45%, etc. Assume that we live in the Gaussian world in which the returns (or daily percentage moves) can be safely modeled using a Normal Distribution. Assume that a year has 256 business days. The following questions concern the standard deviation of returns (i.e., of the percentage moves), the “sigma” that is used for volatility in financial applications. What is the daily sigma? What is the yearly sigma?
Jerome Friedman’s paper titled, “On bias, variance, 0/1-loss, and the curse-of-dimensionality ”, provides a great insight in to the way classification errors work.
The paper throws light on the way bias and variance conspire to make some of the highly biased methods perform well on test data. Naive Bayes works, KNN works and so do many such classifiers that are highly biased. This paper gives the actual math behind classification error and shows that the additive nature of bias and variance that holds good for estimation error cannot be generalized to classification error. There is a multiplier effect, which the author calls it ``boundary bias’’ that makes a biased method perform well. Also this paper provides the right amount of background to explore Domingos framework that provides a nice solution to the misclassification loss function decomposition, consistent with concepts of bias and variance.
Via Letters Of Note
Back in 2006, a group of students at Xavier High School in New York City (one of whom, “JT,” submitted this letter) were given an assignment by their English teacher, Ms. Lockwood, that was to test their persuasive writing skills: they were asked to write to their favourite author and ask him or her to visit the school. Five of those pupils chose Kurt Vonnegut . His thoughtful reply, seen below, was the only response the class received.
There is another interesting difference that is worth pondering. Consider the problem of estimating a mixture of Gaussians. In Statistics we think of this as a solved problem. You use, for example, maximum likelihood which is implemented by the EM algorithm. But the EM algorithm does not solve the problem. There is no guarantee that the EM algorithm will actually find the MLE; it’s a shot in the dark. The same comment applies to MCMC methods. In ML, when you say you’ve solved the problem, you mean that there is a polynomial time algorithm with provable guarantees. There is, in fact, a rich literature in ML on estimating mixtures that do provide polynomial time algorithms. Furthermore, they come with theorems telling you how many observations you need if you want the estimator to be a certain distance from the truth, with probability at least 1-
. This is typical for what is expected of an estimator in ML. You need to provide a provable polynomial time algorithm and a finite sample (non-asymptotic) guarantee on the estimator.
- Elbert Hubbard

Here is a detailed book summary
 Takeaway :
I think this book needs to be read after having some understanding of BUGS software and also having some R/S programming skills. That familiarity can help you simulate and check for yourself the various results and graphs, the author uses to illustrate Bayesian concepts. The book starts by explaining the essence of any econometric model and the way in which an econometrician has to put in assumptions to obtain posterior distribution of various parameters. The core of the book is covered in three chapters, the first two chapters covering model estimation and model checking, and the fourth chapter of the book covering MCMC techniques. The rest of the chapters cover linear models, non linear models and time series models. There are two chapters, one on Panel data and one on Instrument variables that are essential for a practicing econometrician for tackling the problem of endogenous variables. BUGS code for all the models explained in the book are given in the appendix and hence the book can serve as a quick reference for BUGS syntax. Overall a self- contained book and a perfect book to start on Bayesian econometric analysis journey.
Via Reuters :
High-speed trader Infinium Capital Management, which has struggled financially, has stopped trading and is working to wind down the company, President Mark Palchak told Reuters on Thursday.
The closure of Chicago-based Infinium reflects pressures on high-speed trading firms stemming from increased competition and regulatory oversight, low interest rates that have hurt volume and volatility, and the uncertain global economic recovery.
Currency broker FXCM Inc and a subsidiary have acquired five trading desks, physical assets and 48 employees from Infinium to start a new joint venture, V3 Markets, Palchak and FXCM said.
As is a tale, so is life: not how long it is, but how good it is, is what matters.
- J K Rowling
If one tries to read some historical developments behind Brownian motion, there is no dearth of material on the web. There are also entire books written that trace the events that lead to Brownian motion and how it was used in various domains. However for the Poisson process, there is a paucity of literature that traces the history. I stumbled on to a note by David Strirzaker that recounts the history behind Poisson processes. I will paraphrase a section from the paper deals with the history.
Via Maya R. Gupta
A summary of bare minimum measure theory stuff one must know, to get going on probability applications.

The author in his preface says that the book is targeted not towards the 1 reader in 100 who will go on to specialize in statistical analysis, but for the other 99 who will only obtain an overview of the subject, yet will have to deal in their professional lives with the design, analysis and interpretation of research by interfacing with specialists in the field. Indeed by the end of the book, a reader can walk away with a decent intuition of the multivariate statistical techniques. To write a book on multivariate stats in plain English is a great achievement and the author deserves a big applause for the same. I think the book needs to be read by any stats newbie wanting to get some intuition behind the multivariate math. For a seasoned stats analyst, the book might give enough “aha” moments as the author manages to strip down all the math behind a technique and explain various techniques in a simple language. There is hardly any prerequisite for reading this book. The first two chapters cover some basics stats and probability concepts to get the reader up to speed. BTW, the first 116 / 278 pages of the book are set aside for introducing the subject, so in a sense the book does an elaborate handholding.
I compute, therefore I understand
- Judea Pearl

This is a great write up on the nuts and bolts of Metropolis Hastings Algorithm. I like such papers that summarize everything about an algorithm with a sound balance of rigor and simplicity. Nowadays even for a simple statistical analysis, one tends to specifying a BUGS model and run MCMC. With BUGS software, Bayes analysis has become accessible to a whole lot of data analysts. The heart of BUGS is the Gibbs sampling algorithm, which is a special case of Metropolis Hastings Algorithm. A crystal clear paper on the same has been written by George Casella and Edward George. The authors of this paper, Siddhartha Chib and Edward Greenberg say that one of their motives in writing down this article was to publish an Casella+George type paper on MH algorithm that can be read and understood by everyone. In the Gibbs sampling algorithm, one can dumb down many math details and provide a good enough overview. Not so in the case of MH algorithm. Some understanding of math concepts is inevitable. Having said that, the authors do not make “continuous Markov Chains “ understanding, as a prerequisite. In that sense, the article almost starts from scratch and gives a thorough explanation of various flavors of MH Algorithm.
Most of us would have come across Occam’s razor principle in the context of variable selection, the essence of which is, “parsimony wins”. However not many would have heard about “Occam’s window” that is relevant in the context of Model selection, i.e. choosing a set of models out of an ocean of potential models. In the stats literature, Occam’s window appears under Bayesian Model Selection
. In this post, I will try to summarize some of the main points from this
fantastic paper by Adrian Raftery. In many disciplines, more so in social sciences, an associative analysis between a dependent variable and a set of predictors can be done in multiple ways. Think back to simple regression between a dependent variable and a large set of independent variables.If there are n predictors, ideally there can be 2^n linear models. The way one might go about taming the model explosion is via forward stepwise/ backward stepwise/ mixture of the two. Inevitably this exercise of choosing one final model gives rise to many problems.
Link : The Journal of Finance( Sep, 1995 )
As early as 1997, the US financial markets comprised blue chip stocks traded by specialists at NYSE , other stocks traded at NASDAQ by specialists and a small scale electronic system. Fast forward to 2012, the US market comprises 40 trading destinations. There are four public exchanges – NYSE, NASDAQ, Direct Edge and BATS. Inside each of these exchanges there are various destinations. NYSE has NYSE Arca, NYSE Amex, NYSE Euro next and NYSE Alternext, NASDAQ has three markets, BATS and Direct Edge have two market destinations with in themselves. There are toxic Dark pools.There are Internalizers – Citadels of the world that execute trades with in their trading pools. The system, as you can see, has become extremely complex. Dark pools and internalizers accounted for 40 % of all trading volume in 2012. The pace of developments have been unbelievable.
Via : Journal of Financial Economics (May 1996)
Usually the first multivariate time series model that one comes across is a VAR model. It is a logical progression from modeling a univariate ARMA process. Most of the textbooks that introduce VAR start off with the Standard VAR and then go at length in to procedures such as estimating the parameters, hypothesis testing for the number of lags to consider, innovation accounting topics such as Impulse Response Decomposition, Forecast error variance decomposition. When one wants to apply VAR to any real world situation, one inevitably starts with Structural VAR. One can easily transform a Structural VAR to Standard VAR and use the standard innovation accounting tools.
This paper by Hasbrouck is about estimating trading costs from transaction prices. One of the classic models used for estimating trading costs is the Roll model. For a plain version of Roll model where the price increments are modeled in a univariate sense, an estimate for the costs is given by a formula that involves square root of negative auto correlation. In cases where there is a positive autocorrelation between the transaction prices, the formula loses its power.
Here is one of the most cited papers in sociology, that is just 1.5 pages long. Good things come in small packages
Choosing models for cross-classifications(Raftery, A.E. (1986)).
This short article by George Casella and Edward George, explains the nuts and bolts of a Gibbs sampler and answers the following questions in simple words :
Great work results when you stop doing only what you know you can do and instead begin pursuing what you believe you might be able to do with a little focused effort.
- Todd Henry
Article Link : Paradox
A cool machine learning app for LaTeX newbies – Detexify
Link : Journal of Finance
There are many microstructure models (asymmetric information models, inventory-control models) that use BUY or SELL indicator associated with a trade as a variable for classifying other variables or use it as an exogenous variable for modeling. But the thing is that one needs to infer this variable from the trades and quotes data. The data feed from any exchange contains trades but one never knows whether the trade was in response to BUY order or a SELL order.
Link : Review of Financial Studies
This paper builds upon the this paper where the authors introduce a trade process model. What do the authors attempt via this study ?
They develop a framework for analyzing the information in a trading process. This is basically Bayesian learning problem where the market market is a Bayesian who updates various probabilities based on the trades that occur through out the day.
The first section of the paper talks about a trade price model, a sequential trade model :
I‘m happy the way 2013 turned out to be, for more than a couple of reasons. One of them is that, I‘ve managed to read a decent #(65) of books.
Link : Paper
This paper was published in Journal of Finance(1992) by Cornell professors, David Easley and Maureen O’Hara. It is one of the classic papers in market microstructure that shows that timing of the trade is not exogenous to price formation process. In this post, I will briefly go over the contents of the paper. The paper starts off giving some basic history of the models where time dimension of the trade is never explored or does not impact the price process. It then introduces a sequential trade set up considering the following probabilities:

The book is a take on how we look at the world and brand something as an advantage and something as a limitation. The things that we attribute as advantages sometimes become limitations and vice-versa. There are three parts to the book and each part has three stories.
Part I: The advantages of disadvantages (and the disadvantage of advantages).
The three stories mentioned in this part of the book go on to illustrate that we are often mislead about the nature of advantage. We think of things as helpful that actually aren’t and think of other things as unhelpful that in reality leave us stronger and wiser.
Prestige is especially dangerous to the ambitious. If you want to make ambitious people waste their time on errands, the way to do it is to bait the hook with prestige. That’s the recipe for getting people to give talks, write forewords, serve on committees, be department heads, and so on. It might be a good rule simply to avoid any prestigious task. If it didn’t suck, they wouldn’t have had to make it prestigious.

The author is a CS professor at SUNY, Stony Brook. This book recounts his experience of building a mathematical system to bet on the play outcomes of what is considered the fastest ball game in the world, “Jai alai”. In the English vernacular this is sometimes spelled as it sounds,that is, “hi-li”. The book recounts the history of the game and how it made to US from Spain and France. However the focus of the book is on using mathematical modeling and computers to analyze the game and design a betting system. The game itself is designed in such a way that it is a textbook case for analyzing the game mathematically. The players enter the competition based on FIFO queue and the player who gets to score 7 points is the winner. It takes hardly a few minutes to understand the game from this wiki .

The book broadly deals with two strategies, “mean reversion” and “momentum”.These strategies cover six chapters of the book, out of which four of them are on mean reversion and two of them are on momentum strategies. Besides these six chapter, there is one chapter on backtesting strategies and there is another on risk management.
Given the importance of backtesting in any strategy, the first chapter starts off with some of the pitfalls of backtesting. It also gives three general methods for backtesting any strategy. First method is the usual frequentist method of testing whether the null : “returns from the strategy is 0”. Second method is to simulate various return paths and check for the number of times the strategy beat the returns based on historical data. The third method involves randomizing the longs and shorts and seeing whether the strategy makes sense. One can also think about a fourth method where you resample the returns series and general price path and then check out your strategy. The author also cautions about the relevance of backtesting and says that any regime shifts will make all the backtesting irrelevant and hence the strategy, despite looking good on paper, is going to fall flat. The author ends with a brief account of the various software available for a algo trader. Even though there are software that are mentioned that could help a non-programming trader, I fail to see what value such software can add. A basic requirement of anybody thinking of algo trading is working knowledge of at least one or two programming languages. UI driven interfaces can only supplement the code and not replace it.
Jai alai – the fastest sport in the world

The following is a deck that I have prepared with some of the main points from the various sections of the book.
[slideshare id=29410907&style=margin-bottom: 5px; border-top: #ccc 1px solid; height: 329px; border-right: #ccc 1px solid; width: 460px; border-bottom: #ccc 0px solid; border-left: #ccc 1px solid&sc=no]
The above deck in pdf format:
Trading and Exchanges - Summary Points
 Takeaway :
This book was published in 2003. In the last 10 years, US markets have changed dramatically and so have other markets all over the world. The dominant form of trading is via Electronic Order Book. Open outcry markets have been almost completely taken over by Screen based trading. Specialists roles have become less prominent with HFT players acting as middlemen.


