The Physics of Wall Street : Review

In the recent years there have been a lot of books written about quants on Wall Street. Some of the books have been a journalistic account of people, events, technologies that have revolutionized Wall Street. Some of the books are more technical that look like applied math/stats books. This book is a welcome addition to the existing literature. The book has been written by a Physics PhD who traces the rise of Physicists on Wall Street. Emanuel Derman wrote his story (My Life as Quant) way back in 2004 and after a long gap, this is another book from a Physicist.
In the recent crisis quants were blamed for their models. Taleb says you can’t model anything other than plain vanilla options and even that is difficult. So, one sees a lot of people saying financial modeling is just a fancy exercise with no meaningful contribution to the financial world. If that is the case, then what are physicists, mathematicians, statisticians doing in finance? Shouldn’t they be disillusioned after they see that modeling in finance is farce? Is money involved making them believe that they are doing something meaningful? There have been a lot of articles blaming physicists and quants for running failing funds and raking up losses. But the story that is lost in whole of this literature is that, “Someone with some business sense had been convinced that the quants were on to something “. The author says that it is this part that got him intrigued and made him research on this subject. In that sense it is a historical account of ideas from physics that made sense in the financial markets and on Wall Street. In this post, I will try to summarize the physicists, mathematicians, scientists mentioned in the book
Primordial Seeds
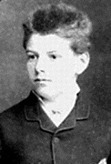
Louis Bachelier
The book starts off with a narrative that aims to capture the efforts of various people who brought scientific thinking in to markets. Some of the events described are:
-
1526: Cardano, a physician and a gambler, writes a book that gives a systematic treatment to probability.
-
1654: Pascal and Fermat work on the foundations of the modern theory of probability
-
1705: Jacob Bernoulli works on relationship between probabilities and frequency of events
-
1900: Louis Bachelier writes his PhD thesis, “The theory of speculation”. It was one of the first attempts to introduce mathematics in to stock markets. He postulated that , if a stock price undergoes a random walk, the probability of it taking a given value after a certain period of time is a Gaussian distribution. He is credited to be the first person to look at markets as random walks. He developed the first option pricing model but it never got popularity as he did not offer any clear insight of incorporating it in to a trading strategy.
-
1905: Einstein explains Brownian motion
-
1930s: The term “model” made its way in to economics , courtesy physicist turned economist, Jan Tinenberg. The term is used in physics to refer to something just shy of a full physical theory. A theory is an attempt to completely and accurately describe some feature of the world. A model, meanwhile is a kind of simplified picture of how a physical process or system works.
-
1930s: DuPont’s famous Nylon project helped demolish the wall between pure physics and applied physics
Swimming Upstream

**Maury Osborne
**
Narrative : 1916-1959
In 1959 Maury Osborne publishes a paper titled” Brownian Motion in the Stock Market”. He argues that it is the rate of return that is normally distributed and not the prices. By establishing that the prices are lognormal and rate of returns are normal, he makes a key change to the price process. Instead of the earlier arithmetic Brownian motion, he argues that stocks follow geometric Brownian motion. He had two arguments up his sleeve. By assuming GBM, the stock prices could never be negative. If the return is a huge negative number, the stock will be very close to 0 but never below 0.The second argument is that the investors care about returns and not about absolute value of stock prices. The success of this model clearly shows that the best mathematical models are the ones that take psychology in to account. Osborne’s story illustrates an important message. Models are built incrementally. He made a surprising connection between his research (migratory efficiency of Salmon) and stock market. Once he realized that probability of up move and down move were different, he changed the assumptions of random walk model to make it better. This sort of approach “looking at data, building a model with assumptions, carefully looking at all the assumptions that breakdown frequently, modifying the model “ , is one of the reasons for Physicists making a breakthrough in finance.
From Coast Lines to Cotton Prices

Benoit B. Mandelbrot
Narrative : 1950 - 2008
Mandelbrot’s PhD thesis on Zipf’s law and his subsequent explorations of fractal geometry turned out to be a bitter pill to most economists. If Mandelbrot’s central ideas are correct, everything traditional economist believe about markets is fundamentally flawed. The assumptions that underlie most of the modern financial theory fall in to the category where random events are treated as outcomes of coin tosses or casino games. God tosses a coin and stock moves up and down based on the outcome. Osborne improved on this when he found that stocks change by fixed percentage rather than fixed amount depending on god’s coin toss outcome. This modification led to the observations that rates of return are normally distributed and prices should be log normally distributed. Mandelbrot was at the other extreme. He believed that random events are not mild as described by normal distributions. They are wild, like the Cauchy distributions. Came across a nice analogy of Cauchy distribution
Imagine a drunken firing squad.Each member stands, rifle in hand, facing a wall. (for argument’s sake, assume the wall is infinitely long.) Just like the drunk walking, the drunks on the firing squad are equally liable to stumble one way as another. When each one steadies himself to shoot the rifle, he could be pointing in any direction at all. the bullet might hit the wall directly in front of him, or it might hit the wall 100 feet to his right (or it might go off in the entirely opposite direction, missing the wall completely). Suppose the group engages in target practice, firing a few thousand shots. If you make a note of where each bullet hits the wall (counting only the ones that hit), you can use this information to come up with a distribution that corresponds to the probability that any given bullet will hit any given part of the wall. When you compare this distribution to the plain old normal distribution, you’ll notice that it’s quite different. the drunken firing squad’s bullets hit the middle part of the wall most of the time — more often, in fact, than the normal distribution would have predicted. But the bullets also hit very distant parts of the wall surprisingly often — much, much more often than the normal distribution would have predicted.this probability distribution is called a Cauchy distribution. Because the left and right sides of the distribution don’t go to zero as quickly as in a normal distribution (because bullets hit distant parts of the wall quite often), a Cauchy distribution is said to have “fat tails.” one of the most striking features of the Cauchy distribution is that it doesn’t obey the law of large numbers: the average location of the firing squad’s bullets never converges to any fixed number. If your firing squad has fired a thousand times, you can take all of the places their bullets hit and come up with an average value — just as you can average your winnings if you’re playing the coin-flip game. But this average value is highly unstable. It’s possible for one of the squad members to get so turned around that when he fires next, the bullet goes almost parallel with the wall. It could travel a hundred miles (these are very powerful guns) — far enough, in fact, that when you add this newest result to the others, the average is totally different from what it was before Because of the distribution’s fat tails, even the long-term average location of a drunken firing squad’s bullets is unpredictable
Fractals exhibit wild randomness. If you try to find the length of a coast line, every time you add observations, the estimate changes so dramatically that the average does not make sense for such thing. There is no expected value for the average size of a feature on a coast line. from one point of view, they are beautifully ordered and regular; from another, wildly random. And if fractals are everywhere, as Mandelbrot believed, the world is a place dominated by extremes, where our intuitive ideas about averages and normalcy can only lead us astray.
Mandelbrot has a freakish gift for visualizing abstract algebraic problems. Working at IBM, he found fractals in income distributions.By analyzing the 20% of the rich people’s incomes, he found that there was another 80-20 rule that separated the rich from ultrarich. In a chance encounter with another professor, he concluded that cotton prices had fractals. He saw fractals everywhere and thus his range of research contributions is truly outstanding.
In 1964, Paul Cootner translates Bachelier’s work and makes it accessible to a large audience. He also includes Mandelbrot’s work. So around 1965 , financial theorists had a choice – follow Osborne or follow Mandelbrot. Cootner made the argument this way at a meeting of the econometric Society, in response to Mandelbrot’s work on cotton prices
Mandelbrot, like Prime Minister Churchill before him, promises us not utopia but blood, sweat, toil, and tears. If he is right, almost all of our statistical tools are obsolete. . . . Almost without exception, past econometric work is meaningless. Surely, before consigning centuries of work to the ash pile, we should like to have some assurance that all our work is truly useless.
According to some, finance took a wrong turn around 1965 by assuming mild randomness. This mild randomness assumption became even more popular, courtesy Eugene Fama. In 1965, Eugene Fama research on efficient market hypothesis sets the path for many economists at University of Chicago.
Beating the Dealer

Ed Thorp
Narrative : 1932 - 1987
Ed Thorp showed that physics and mathematics can be used to profit from financial markets. Information theory proved to be the missing link between the statistics of market prices and winning strategy on Wall Street. Card card counting is a process by which you gain information about the deck of cards — you learn how the composition of the deck has changed with each hand. Ed Thorp was the first one to connect the information flows and money management principles. Connecting Shannon’s information theory and Kelly’s criterion, he applied their principles to stock markets. Ed Thorp took the side of Osborne as he believed in the random walk of returns. His interest in warrant pricing made him the first person to have cracked option pricing with replication argument. He never published this stuff and thus options pricing remained elusive until Black Scholes worked out the pricing. Also his approach made it a trading strategy rather than a replication strategy, the latter was very appealing to banks selling options. Ed Thorp created an arbitrage strategy between warrants and stocks. By creating a delta hedge on the warrants and using his knowledge from blackjack, he ran a successful quant fund (of Princeton-Newport , 20% returns every year for 40 years) that launched a slew of quant funds in the decade that followed.
Physics Hits the Street
 [
[ [
[
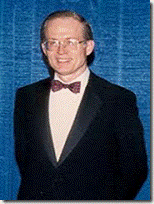
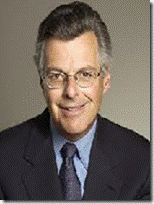
Fischer Black – Myron Scholes – Robert Merton
Narrative : 1964 - 1987
These years were characterized by physicists moving over to Wall Street in big numbers, thanks to Black Scholes and Merton model and exponential rise of derivative trading and market making. Thorp took Osborne’s idea and assumed that the option should be priced as a fair bet, worked out the option price and then created a delta hedging strategy. Black Scholes approach was the reverse. They created a dynamic replicating portfolio and argued using CAPM that this should yield a risk free rate of return. In this risk neutral world, one can price the option. This approach became popular and useful as compared to Thorpe’s as the banks could now manufacture an option. Thus the role of market making for options exploded using black schools replicating strategy. This blind faith in Black Scholes ended in a rude shock , thanks to 1987 stock market crisis. An intense work on reworking on some of the assumptions of Black Scholes was taken up by many quants.

Derman
Emanuel Derman came up pricing with the volatility smile that appeared in the markets, post 1987 crash. Several other tweaks were made to Black Scholes pricing to relax the strict assumptions of the original model.
The Prediction company
 [
[
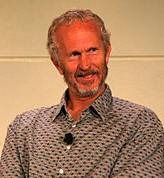
James Doyne Farmer & Norman Packard
Narrative : 1975 - 1999
The story is about two physicists who go on to start a company, “The Prediction company”, with the purpose of applying chaos theory and nonlinear forecasting techniques to cull out patterns at a micro level. This was one of the first companies on Wall Street that used “Black Box” models for creating trading strategies. The wild success of “The Prediction company” can be attributed to luck, but who knows, maybe they were on to something that enabled them to read the micro level inefficiencies in the market and let them capitalize on them. One thing is certain from reading their story : their years of toil behind making their first company “eudaemonia”, a group that developed strategies to win roulette gave them a ton of learning, which they finally managed to translate in to winning strategies on Wall Street.
Tyranny of the Dragon King

Didier Sornette
Narrative : 1983 - 2012
I have learnt a new term from the book, “Dragon King”, a word coined by Didier Sornette describing extreme events that come with a warning. These events are different from “Black Swan” kind of events that are completely unpredictable.
“Dragon Kings” : The word, “king” because, if you try to match plots like Pareto’s law—the fat-tailed distribution governing income disparity that Mandelbrot studied at IBM — to countries that have a monarchy, you find that kings don’t fit with the 80–20 rule. Kings control far more wealth than they ought to, even by the standards of fat tails. they are true outliers. And they, not the extremely wealthy just below them, are the ones who really exert control. The word dragon, meanwhile, is supposed to capture the fact that these kinds of events don’t have a natural place in the normal bestiary. They’re unlike anything else. Many large earthquakes are little ones that, for whatever reason, didn’t stop. These are not predictable using Sornette’s methods. But dragon-king earthquakes, the critical events, seem to require more. Like ruptures, they happen only if all sorts of things fall into place in just the right way.
Sornette’s story is presented in the book to cite an example of the way scientific principles can be applied to finance at a macro level. A physicist by profession, Sornette has contributed in a dozen fields ranging from material science material science to geophysics, to decision theory , even to neuroscience. In all these fields, Sornette’s work involves identifying patterns endemic to the structures of the complex systems and using these patterns to predict critical phenomenon. His work lies on an assumption that there are always telltale patterns of self-organization, coordination before an extreme event. His theory is not so much about predicting the next tulip mania or next disaster. Instead his methodology helps in identifying situations when herding effects have already taken place. He then uses the system conditions to predict the critical point when the entire thing explodes. Sornette has successfully applied his methodology to a host of crisis situations in the last 20 years, including the subprime mess. The story is very interesting because it tells about a physicist who has used Mandelbrot’s methods and has successfully identified many systems that had become instable. So, in one sense when the whole army of economists and finance researchers were moving along the Osborne lead path, there were a few renegades who struck gold and Sornette is one amongst them.
A New Manhattan Project
 [
[ **
**
Eric Weinstein & Pia Malaney**
Narrative : 1988 - 2012
This story is about the couple, Eric Weinstein (mathematician) & Pia Malaney(economist) who come together to solve the index number problem. The CPI is a metric that captures the cost of ordinary things a person buys, a metric that is notoriously difficult to calculate as it needs to compare values at different times, for people living with different lifestyles. Economists world over realize that CPI needs to be fixed, but still nothing much has been done. Eric and Pia have brought fresh thinking in to economics by introducing “gauge theory” principles in various contexts. They firmly believe that economists need to broaden their theoretical framework to account for a wider variety of phenomena, i.e., the need of the hour is a new generation of theories and models, suited for the complexity of the modern world. It calls for a large-scale collaboration between economists and researchers from physics and other fields - an economic Manhattan Project
 Takeaway:
The book is about 200 pages long and out of which 160 odd pages contain stories that are already mentioned in other books. Having said that, I found the book hard to put down as it is fast paced and well written. The good thing about the book is that it is not a model bashing book but acknowledges that good models are a combination of math, stats, investor psychology and a ton of common sense. “Only through repeated iterations can models be truly useful”, is the takeaway from this book.