Chapter 7 - Positioning
Purpose
This script comprises my experiements on NIFTYBees dataset with the help of the plots mentioned in Positioning dataset
entry.exit , master and positions are already created before running this script.
> entry.exit.rel <- subset(entry.exit, duration > 0) > entry.exit.rel$yr <- (as.POSIXlt(entry.exit.rel$entry))$year + + 1900 > entry.exit.rel$yr <- as.factor(entry.exit.rel$yr) |
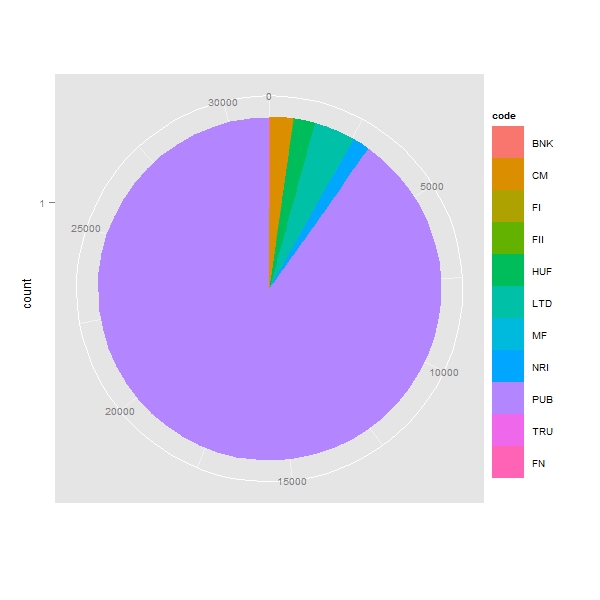
pie chart
> p <- ggplot(master, aes(x = factor(1), fill = code))
> q <- p + geom_bar()
> r <- q + coord_polar(theta = "y") + xlab("") + ylab("")
> print(r) |
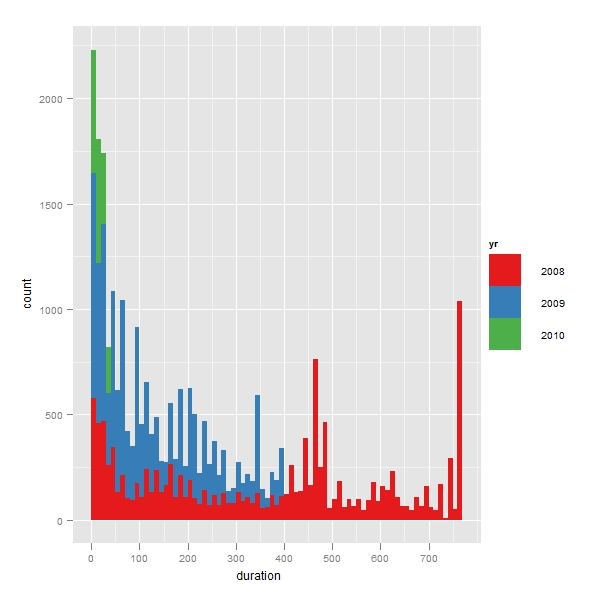
Bar Chart
> temp <- entry.exit.rel
> temp.master <- master[, c("id", "code")]
> temp <- merge(temp, temp.master, all.x = T)
> temp <- temp[temp$code != "FI" & temp$code != "FN", ]
> p <- ggplot(temp, aes(duration, fill = yr)) + ylab("")
> q <- p + geom_bar(binwidth = 10) + scale_fill_brewer(pal = "Set1") +
+     ylab("")
> print(q) |
> code <- as.character(temp$code) > code.f <- factor(code) > temp$code <- code.f > temp <- temp[temp$code == "PUB", ] > code <- as.character(temp$code) > code.f <- factor(code) > temp$code <- code.f |

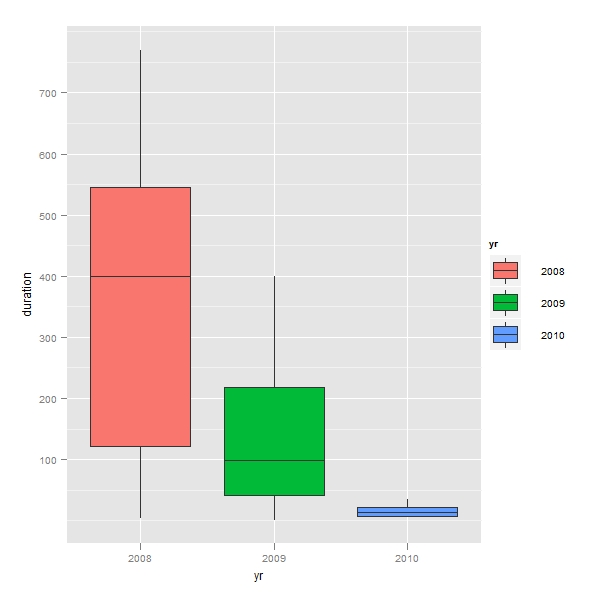
boxplot
> p <- ggplot(temp, aes(x = yr, y = duration, fill = yr)) > q <- p + geom_boxplot(binwidth = 10) > r <- q > print(r) |

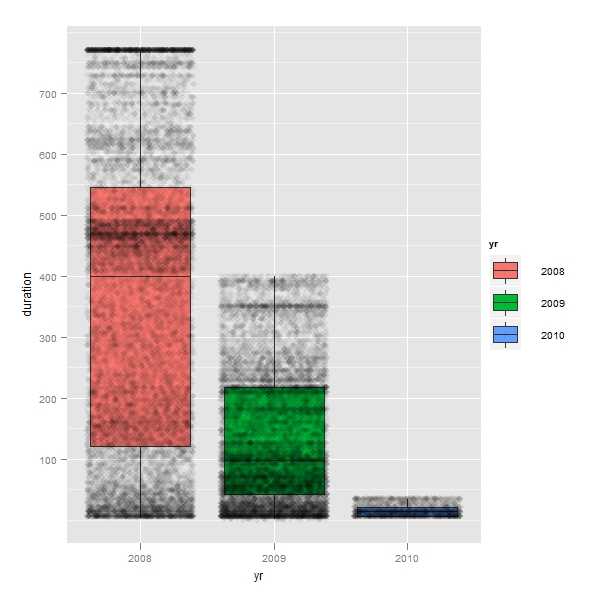
boxplot with jitter
> p <- ggplot(temp, aes(x = yr, y = duration, fill = yr))
> q <- p + geom_boxplot(binwidth = 10)
> r <- q + geom_jitter(colour = alpha("black", 1/20))
> print(r) |
facet_grid
Single row with multiple columns
> p <- ggplot(temp, aes(x = yr, y = duration, fill = yr)) > q <- p + geom_boxplot(binwidth = 10) > r <- q + facet_grid(. ~ code) > print(r) |
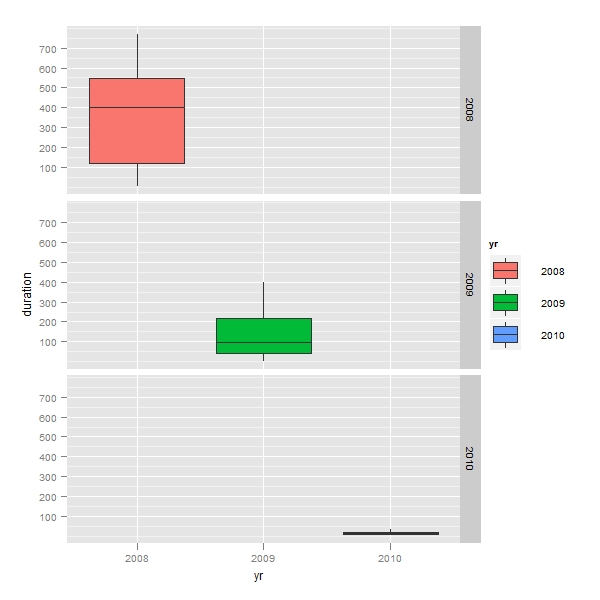
Single column with multiple rows
> p <- ggplot(temp, aes(x = yr, y = duration, fill = yr)) > q <- p + geom_boxplot(binwidth = 10) > r <- q + facet_grid(yr ~ .) > print(r) |

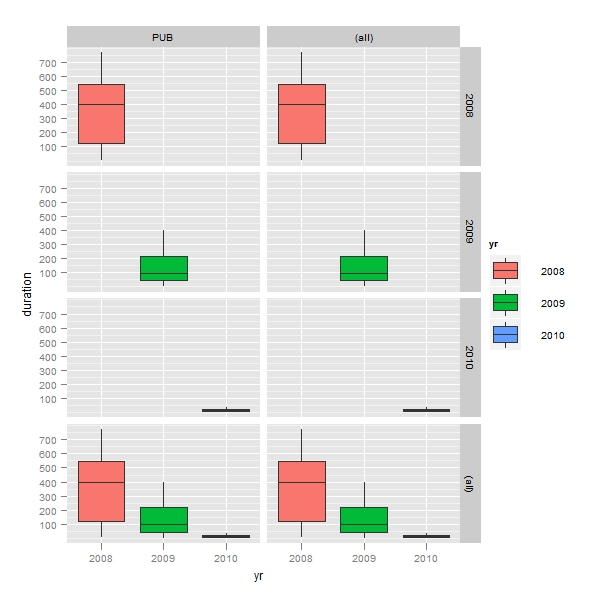
Multiple columns with Multiple rows
> p <- ggplot(temp, aes(x = yr, y = duration, fill = yr)) > q <- p + geom_boxplot(binwidth = 10) > r <- q + facet_grid(yr ~ code) > print(r) |
Multiple columns with Multiple rows and Margins
> p <- ggplot(temp, aes(x = yr, y = duration, fill = yr)) > q <- p + geom_boxplot(binwidth = 10) > r <- q + facet_grid(yr ~ code, margins = T) > print(r) |