Hobson GLM - Exercise 6.3
Purpose
To work out exercise 6.3 from Hobson’s book ’'
> folder <- "C:/Cauldron/garage/R/soulcraft/Volatility/Learn/Dobson-GLM/" > file.input <- paste(folder, "Table 6.3 Carbohydrate diet.csv", + sep = "") > data <- read.csv(file.input, header = T, stringsAsFactors = F) |
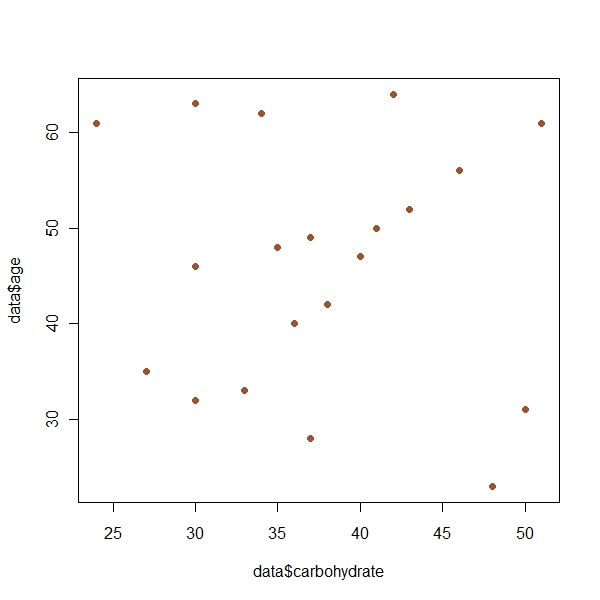
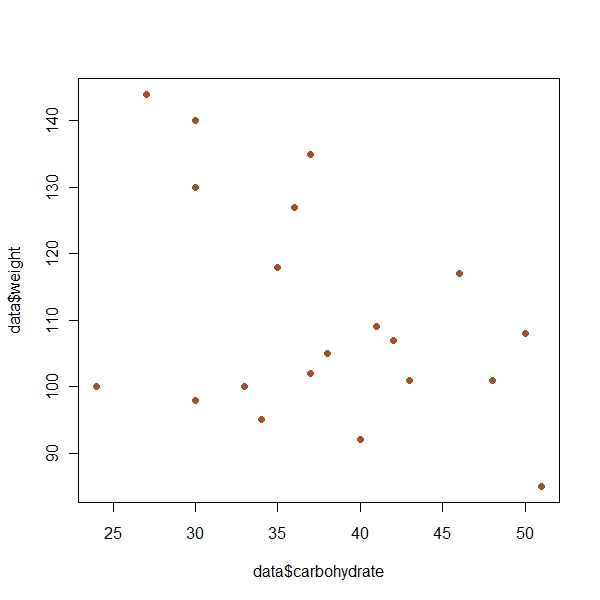
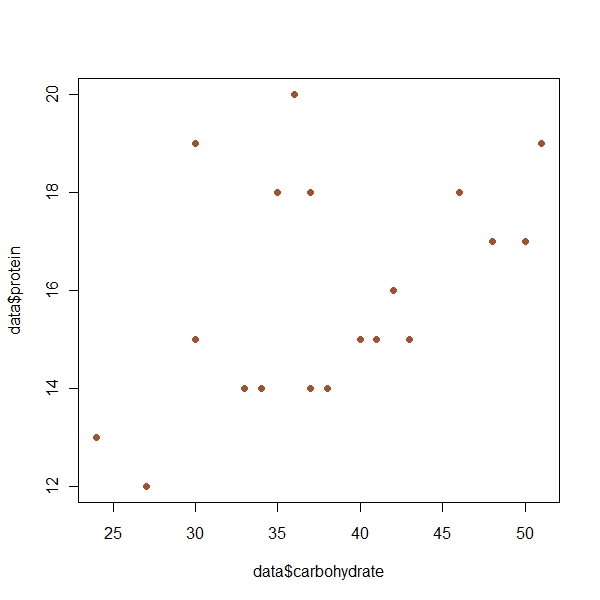
Plot the responses y against each ofthe explanatory variables x1, x2 and
x3 to see if y appears to be linearly related to them.
> par(mfrow = c(1, 1)) > plot(data$carbohydrate, data$age, pch = 19, col = "sienna") |
> par(mfrow = c(1, 1)) > plot(data$carbohydrate, data$weight, pch = 19, col = "sienna") |
> par(mfrow = c(1, 1)) > plot(data$carbohydrate, data$protein, pch = 19, col = "sienna") |
Fit the model (6.6) and examine the residuals to assess the adequacy of the model and the assumptions.
> fit1 <- lm(carbohydrate ~ age + weight + protein, data)
> summary(fit1)
Call:
lm(formula = carbohydrate ~ age + weight + protein, data = data)

Residuals:
     Min       1Q   Median       3Q      Max
-10.3424  -4.8203   0.9897   3.8553   7.9087

Coefficients:
            Estimate Std. Error t value Pr(>|t|)
(Intercept) 36.96006   13.07128   2.828  0.01213 *
age         -0.11368    0.10933  -1.040  0.31389
weight      -0.22802    0.08329  -2.738  0.01460 *
protein      1.95771    0.63489   3.084  0.00712 **
---
Signif. codes:  0 '***' 0.001 '**' 0.01 '*' 0.05 '.' 0.1 ' ' 1

Residual standard error: 5.956 on 16 degrees of freedom
Multiple R-squared: 0.4805,     Adjusted R-squared: 0.3831
F-statistic: 4.934 on 3 and 16 DF,  p-value: 0.01297
> fit2 <- lm(carbohydrate ~ age + protein, data)
> summary(fit2)
Call:
lm(formula = carbohydrate ~ age + protein, data = data)

Residuals:
     Min       1Q   Median       3Q      Max
-11.2692  -5.9968   0.9902   5.7952   9.5474

Coefficients:
            Estimate Std. Error t value Pr(>|t|)
(Intercept) 15.08848   12.16239   1.241   0.2316
age         -0.09167    0.12818  -0.715   0.4842
protein      1.68189    0.73693   2.282   0.0356 *
---
Signif. codes:  0 '***' 0.001 '**' 0.01 '*' 0.05 '.' 0.1 ' ' 1

Residual standard error: 7.002 on 17 degrees of freedom
Multiple R-squared: 0.2372,     Adjusted R-squared: 0.1475
F-statistic: 2.643 on 2 and 17 DF,  p-value: 0.1001
> fit3 <- lm(carbohydrate ~ protein, data)
> summary(fit3)
Call:
lm(formula = carbohydrate ~ protein, data = data)

Residuals:
    Min      1Q  Median      3Q     Max
-12.498  -5.983   0.902   4.887  10.662

Coefficients:
            Estimate Std. Error t value Pr(>|t|)
(Intercept)  12.4787    11.4435   1.090   0.2899
protein       1.5800     0.7131   2.216   0.0399 *
---
Signif. codes:  0 '***' 0.001 '**' 0.01 '*' 0.05 '.' 0.1 ' ' 1

Residual standard error: 6.907 on 18 degrees of freedom
Multiple R-squared: 0.2143,     Adjusted R-squared: 0.1706
F-statistic: 4.909 on 1 and 18 DF,  p-value: 0.03986
> fit4 <- lm(carbohydrate ~ weight + protein, data)
> summary(fit4)
Call:
lm(formula = carbohydrate ~ weight + protein, data = data)

Residuals:
     Min       1Q   Median       3Q      Max
-10.6812  -3.9135   0.9464   4.0880   9.7948

Coefficients:
            Estimate Std. Error t value Pr(>|t|)
(Intercept) 33.13032   12.57155   2.635   0.0174 *
weight      -0.22165    0.08326  -2.662   0.0164 *
protein      1.82429    0.62327   2.927   0.0094 **
---
Signif. codes:  0 '***' 0.001 '**' 0.01 '*' 0.05 '.' 0.1 ' ' 1

Residual standard error: 5.971 on 17 degrees of freedom
Multiple R-squared: 0.4454,     Adjusted R-squared: 0.3802
F-statistic: 6.827 on 2 and 17 DF, p-value: 0.006661 |
anova model
> summary(aov(carbohydrate ~ age + weight + protein, data))
            Df Sum Sq Mean Sq F value   Pr(>F)
age          1   3.82    3.82  0.1076 0.747136
weight       1 183.98  183.98  5.1856 0.036859 *
protein      1 337.34  337.34  9.5082 0.007121 **
Residuals   16 567.66   35.48
---
Signif. codes: 0 '***' 0.001 '**' 0.01 '*' 0.05 '.' 0.1 ' ' 1 |
Residuals 16 567.66
> summary(aov(carbohydrate ~ weight + protein, data))
            Df Sum Sq Mean Sq F value  Pr(>F)
weight       1 181.38  181.38   5.088 0.03756 *
protein      1 305.40  305.40   8.567 0.00941 **
Residuals   17 606.02   35.65
---
Signif. codes: 0 '***' 0.001 '**' 0.01 '*' 0.05 '.' 0.1 ' ' 1 |
Residuals 17 606.02
> pf((606.02 - 567.66)/(567.66/16), 1, 16) [1] 0.6861142 |
Cannot do away with age variable
> summary(aov(carbohydrate ~ age + protein, data))
            Df Sum Sq Mean Sq F value  Pr(>F)
age          1   3.82    3.82  0.0779 0.78358
protein      1 255.41  255.41  5.2089 0.03562 *
Residuals   17 833.57   49.03
---
Signif. codes: 0 '***' 0.001 '**' 0.01 '*' 0.05 '.' 0.1 ' ' 1 |
Residuals 17 833.57
> summary(aov(carbohydrate ~ protein, data))
            Df Sum Sq Mean Sq F value  Pr(>F)
protein      1 234.15  234.15  4.9085 0.03986 *
Residuals   18 858.65   47.70
---
Signif. codes: 0 '***' 0.001 '**' 0.01 '*' 0.05 '.' 0.1 ' ' 1 |
Residuals 18 858.65
> pf((858.65 - 833.57)/(833.57/17), 1, 17) [1] 0.5157968 |
Cannot do away with age variable