Location Dispersion Bar
Location Dispersion Bar
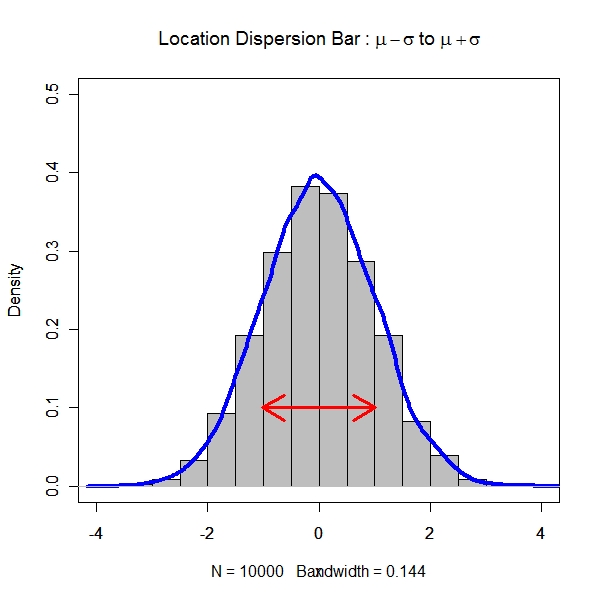
> x <- rnorm(10000, 0, 1)
> xrange <- c(-4, 4)
> yrange <- c(0, 0.5)
> title <- expression(paste("Location Dispersion Bar : ", mu -
+     sigma, " to ", mu + sigma))
> hist(x, prob = T, xlim = xrange, ylim = yrange, col = "grey",
+     main = title)
> par(new = T)
> plot(density(x), xlim = xrange, ylim = yrange, col = "blue",
+     lwd = 4, main = "")
> arrows(mean(x) - sd(x), 0.1, mean(x) + sd(x), 0.1, lwd = 3, col = "red",
+ code = 3) |