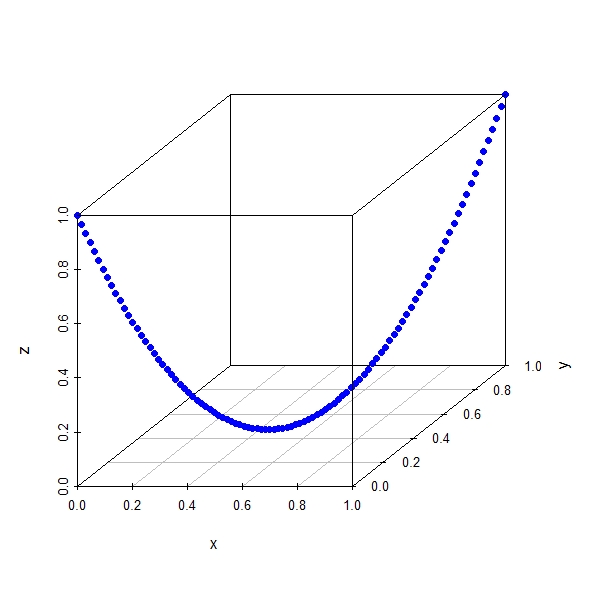
Playing with Basic Copula
> library(scatterplot3d) |
> x <- seq(0, 1, 0.01) > y <- seq(0, 1, 0.01) > z <- (2 * x - 1) * (2 * y - 1) > scatterplot3d(x, y, z, color = "blue", pch = 19) |
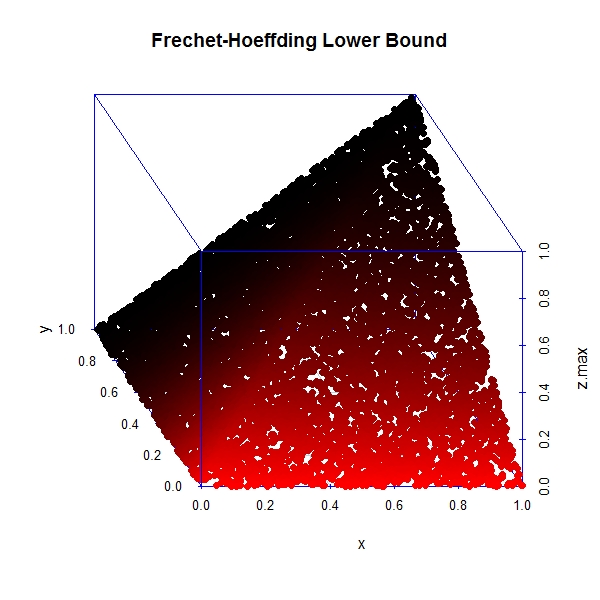
Frechet-Hoeffding Lower Bound
> par(mfrow = c(1, 1)) > n <- 10000 > x <- runif(n) > y <- runif(n) > z.max <- pmin(x, y) > z.min <- pmax(x + y - 1, 0) > scatterplot3d(x, y, z.max, pch = 16, angle = 120, col.grid = "lightblue", + highlight.3d = T, col.axis = "blue", main = "Frechet-Hoeffding Lower Bound") |
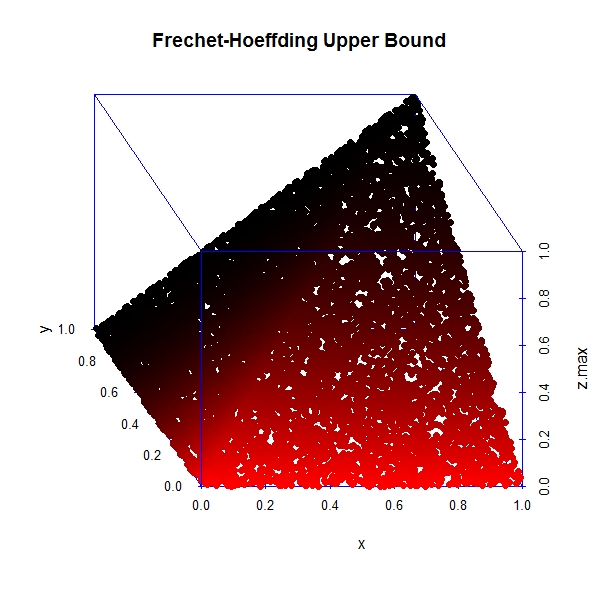
Frechet-Hoeffding Upper Bound
> par(mfrow = c(1, 1)) > n <- 10000 > x <- runif(n) > y <- runif(n) > z.max <- pmin(x, y) > z.min <- pmax(x + y - 1, 0) > scatterplot3d(x, y, z.max, pch = 16, angle = 120, col.grid = "lightblue", + highlight.3d = T, col.axis = "blue", main = "Frechet-Hoeffding Upper Bound") |
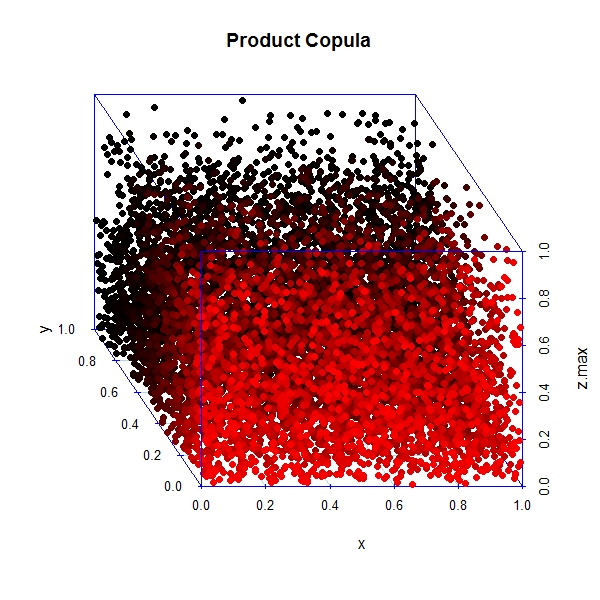
Product Copula
> par(mfrow = c(1, 1)) > n <- 10000 > x <- runif(n) > y <- runif(n) > z <- (x * y) > scatterplot3d(x, y, z.max, pch = 16, angle = 120, col.grid = "lightblue", + highlight.3d = T, col.axis = "blue", main = "Product Copula") |