Base Graphics
Purpose
DB on graphics base
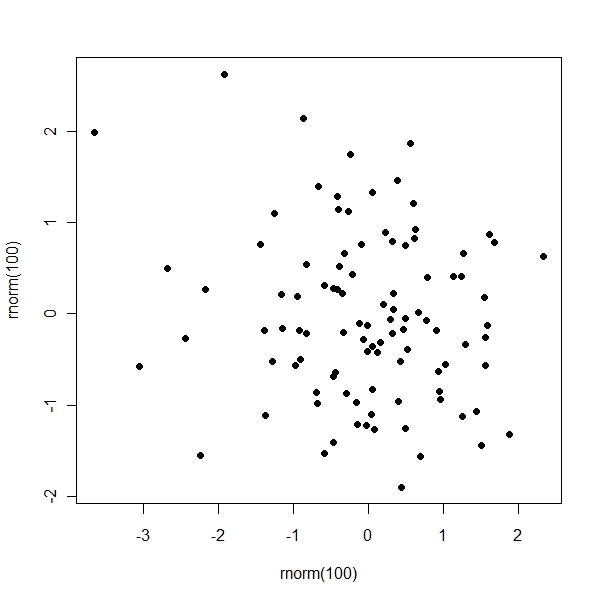
Using the margins
> par(mar = c(5, 4, 3, 2)) > plot(rnorm(100), rnorm(100), pch = 19) |
Squares
> par(mar = c(1, 1, 1, 1)) > plot.new() > plot.window(xlim = c(0, 1), ylim = c(0, 1)) > rect(xleft = 0.1, ybottom = 0.1, xright = 0.9, ytop = 0.9) |

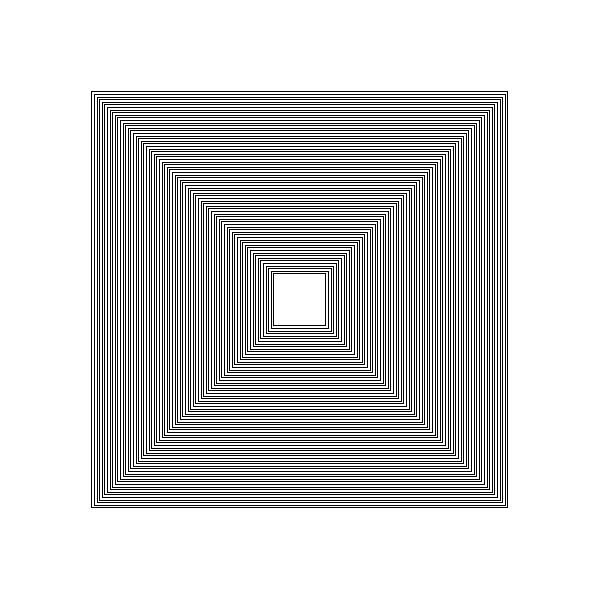
Nested Squares
> par(mar = c(1, 1, 1, 1)) > plot.new() > plot.window(xlim = c(0, 1), ylim = c(0, 1)) > xl <- seq(0.1, 0.45, 0.005) > xr <- 1 - xl > yb <- seq(0.1, 0.45, 0.005) > yt <- 1 - yb > rect(xleft = xl, ybottom = yb, xright = xr, ytop = yt) |
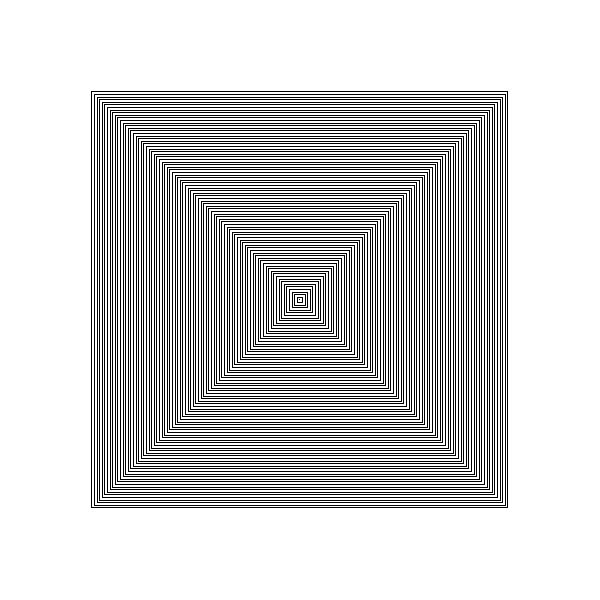
Ihaka’s code
> par(mar = c(1, 1, 1, 1)) > plot.new() > plot.window(xlim = c(0, 1), ylim = c(0, 1)) > p <- seq(0.1, 0.5, 0.005) > rect(xleft = p, ybottom = p, xright = 1 - p, ytop = 1 - p) |
Drawing a Circle
> par(mar = c(1, 1, 1, 1)) > plot.new() > theta <- seq(0, 2 * pi, length = 72) > x <- cos(theta) > y <- sin(theta) > plot.window(xlim = c(-1, 1), ylim = c(1, -1)) > lines(x, y) |

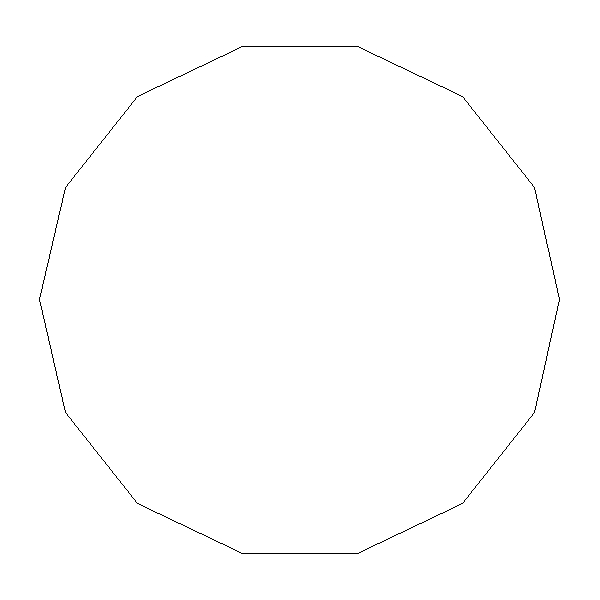
Drawing a Circle with lesser theta
> par(mar = c(1, 1, 1, 1)) > plot.new() > theta <- seq(0, 2 * pi, length = 15) > x <- cos(theta) > y <- sin(theta) > plot.window(xlim = c(-1, 1), ylim = c(1, -1)) > lines(x, y) |
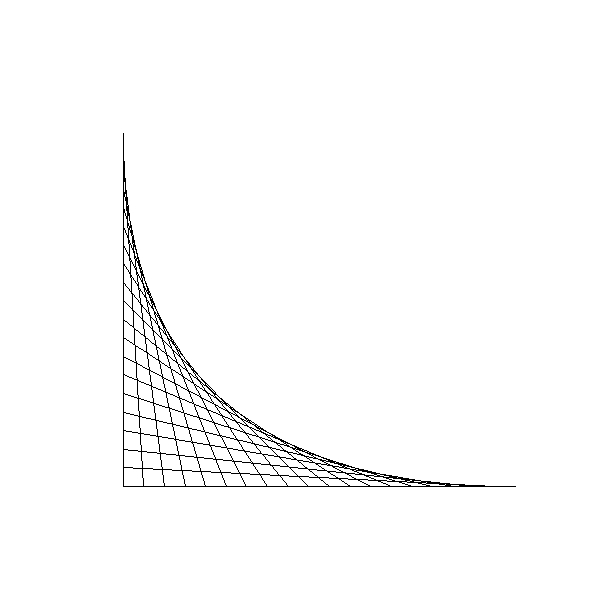
Curve Example
> x1 <- seq(0, 1, length = 20) > y1 <- rep(0, 20) > x2 <- rep(0, 20) > y2 <- seq(0.9, 0, length = 20) > plot.new() > plot.window(xlim = c(0, 1), ylim = c(0, 1), asp = 1) > segments(x1, y1, x2, y2) |
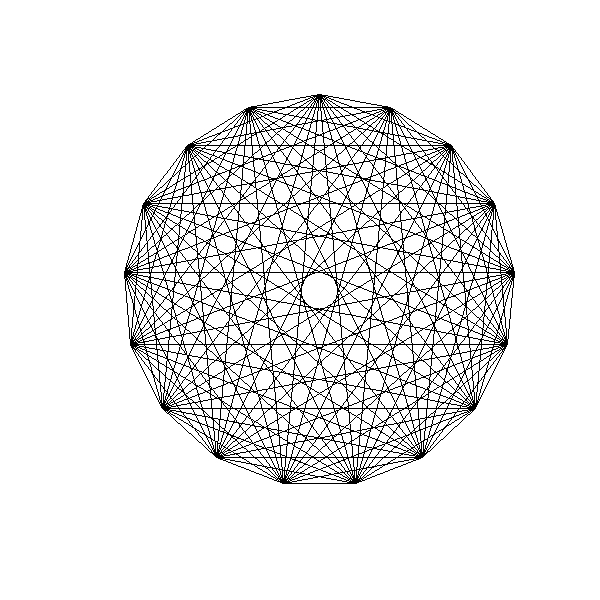
Rosette with 17 vertices
> par(mar = c(1, 1, 1, 1)) > plot.new() > theta <- seq(0, 2 * pi, length = 17) > x <- cos(theta) > y <- sin(theta) > plot.window(xlim = c(-1, 1), ylim = c(1, -1)) > lines(x, y, col = "red", lwd = 4) > n <- 10000 > points <- sample(1:17, n, replace = T) > par(new = T) > lines(x[points], y[points]) |
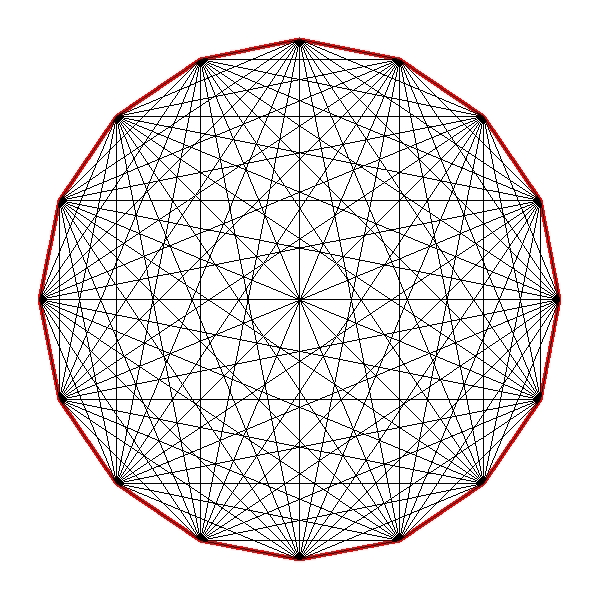
Ihaka code
> n = 17 > theta = seq(0, 2 * pi, length = n + 1)[1:n] > x = sin(theta) > y = cos(theta) > v1 = rep(1:n, n) > v2 = rep(1:n, rep(n, n)) > plot.new() > plot.window(xlim = c(-1, 1), ylim = c(-1, 1), asp = 1) > segments(x[v1], y[v1], x[v2], y[v2]) |