Lecture 7 Ihaka Graphics
Purpose
Lecture 7 of Ihaka - Information visualization
Graph 1
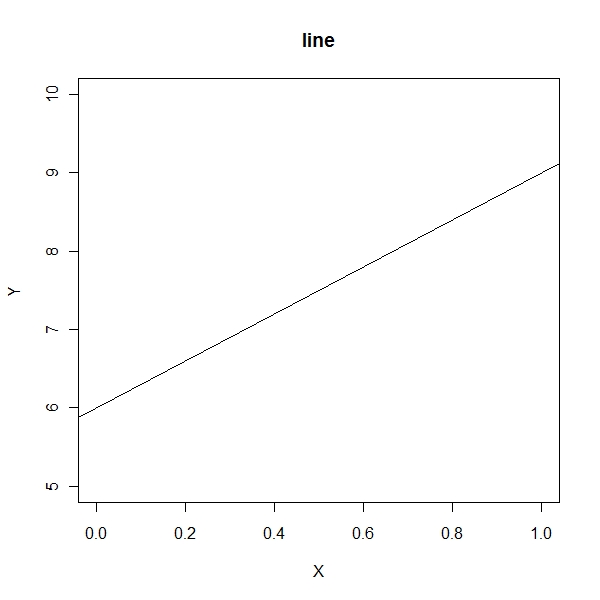
> plot.new() > plot.window(xlim = c(0, 1), ylim = c(5, 10)) > abline(a = 6, b = 3) > axis(1) > axis(2) > title(main = "line") > title(xlab = "X") > title(ylab = "Y") > box() |
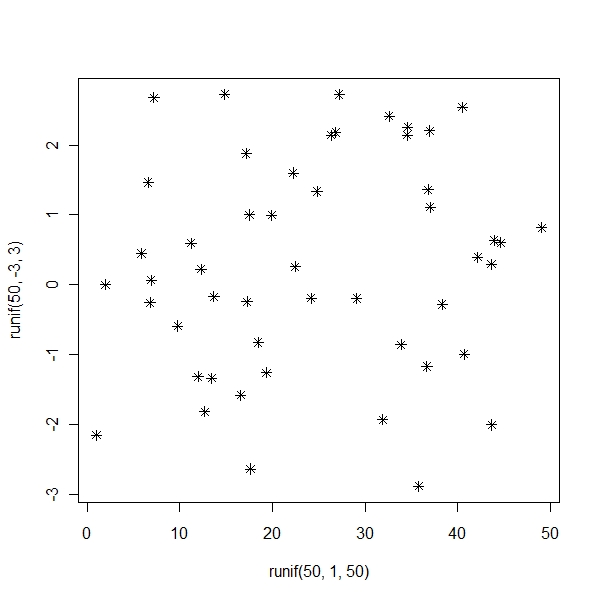
> plot(runif(50, 1, 50), runif(50, -3, 3), pch = 8) |
> plot.new() > rect(0, 0, 1, 1) |

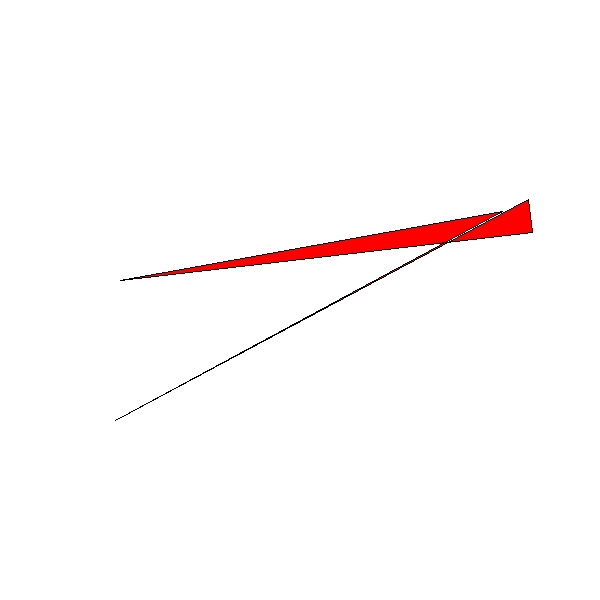
> plot.new() > x <- cbind(runif(5), runif(5)) > polygon(x[, 1], x[, 2], col = "red") |
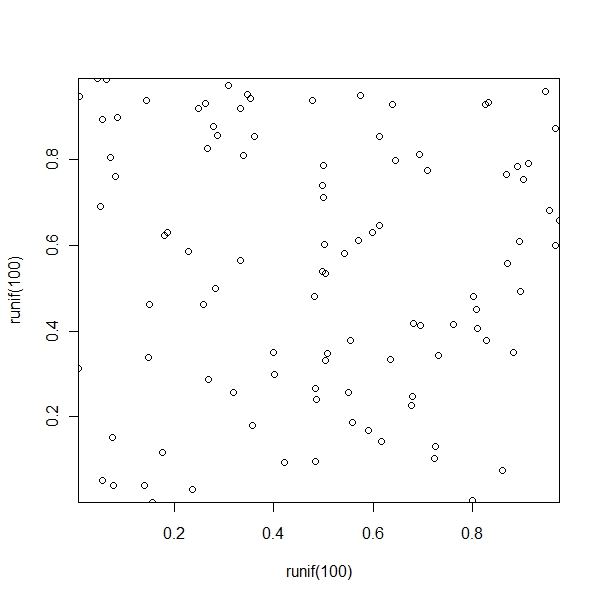
This expansion can be inhibited by specifying xaxs=“i” and/or yaxs=“i”.
> plot(runif(100), runif(100), xaxs = "i", yaxs = "i") |
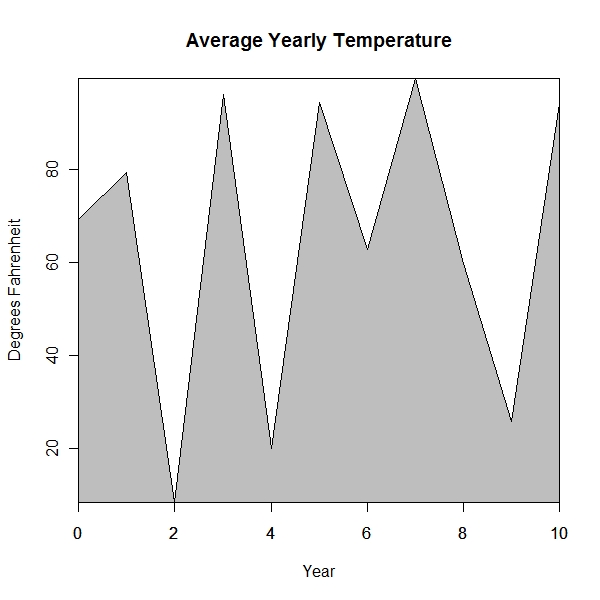
> y <- runif(11, 1, 100) > x <- 0:10 > x <- sort(x, decreasing = F) > plot(x, y, type = "l", xaxs = "i", yaxs = "i", xlab = "", ylab = "", + main = "") > xx = c(0, x, 10) > yy = c(0, y, 0) > polygon(xx, yy, col = "gray") > axis(1) > box() > title(main = "Average Yearly Temperature") > title(ylab = "Degrees Fahrenheit") > title(xlab = "Year") |
Takeaways points(x, y, pch=int, col=str) lines(x, y, lty=str, lwd=num, col=str) segments(x0, y0, x1, y1) arrows(x0, y0, x1, y1, code=int,length=num, angle=num) rect(x0, y0, x1, y1, col=str, border=str) polygon(x, y, col=str, border=str) text(x, y, labels) legend(xloc, yloc,legend = c(“Exact”, “Approximate”),lty = c(“solid”, “dotted”), xjust = 1, yjust = 1) axis(1, at=1:4, lab=c(“A”, “B”, “C”, “D”))