Trial of Pyx
Purpose
To visualize trial of pyx
By errroneously assuming that the variance of sum of 100 coins would be 100 times the variance of individual coins, the bands were put.
> par(mfrow = c(1, 2)) > n <- 100 > mean.true <- 128 > sig.true <- 128/400 > sig.allowed <- 128/400 * sqrt(n) > x1 <- rnorm(10000, mean.true, sig.true) > x2 <- rnorm(10000, mean.true, sig.allowed) > xrange <- c(min(c(x1, x2)), max(c(x1, x2))) > yrange <- c(0, 2600) > breaks <- seq(110, 150, 1) > hist(x2, col = "red", xlab = "Wt of 1 coin", ylab = "", breaks = breaks, + xlim = xrange, main = " Gold in one coin", yaxt = "n", ylim = yrange) > par(new = T) > hist(x1, col = "darkgreen", yaxt = "n", xlab = "", ylab = "", + xlim = xrange, ylim = yrange, breaks = breaks, main = "") > n <- 100 > mean.true <- 128 * n > sig.true <- 128/400 * sqrt(n) > sig.allowed <- 128/400 * (n) > x1 <- rnorm(10000, mean.true, sig.true) > x2 <- rnorm(10000, mean.true, sig.allowed) > xrange <- c(min(c(x1, x2)), max(c(x1, x2))) > yrange <- c(0, 2600) > breaks <- seq(range[1] - 10, range[2] + 10, 10) > hist(x2, col = "red", yaxt = "n", xlab = "Wt of 100 coins", ylab = "", + xlim = xrange, ylim = yrange, main = "Trial of Pyx ") > par(new = T) > hist(x1, col = "darkgreen", yaxt = "n", xlab = "", ylab = "", + xlim = xrange, ylim = yrange, main = "") |
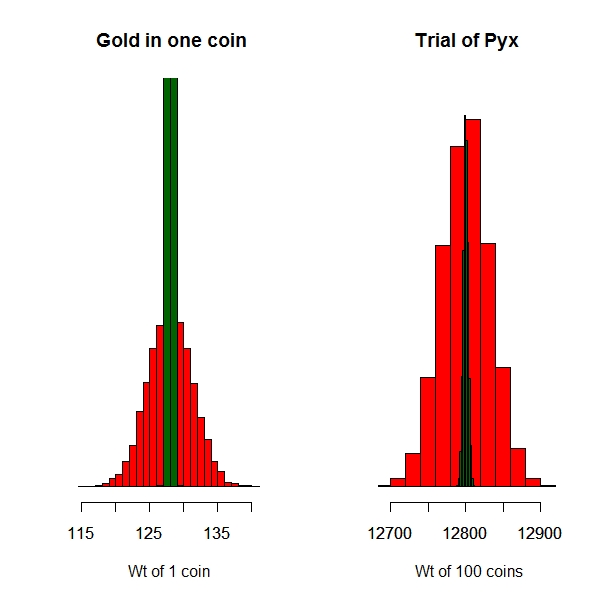
Darkgreen should have been the area but the allowed area is red
Which means at an individual level, there could be wider range of variability to take advantage of this higher limits
Darkgreen is what the admin thought that will be used but what got used was the red area Six hundred years of Fraud!