Ch2- 3 - Johnson
Purpose - Johnson Inference of Means
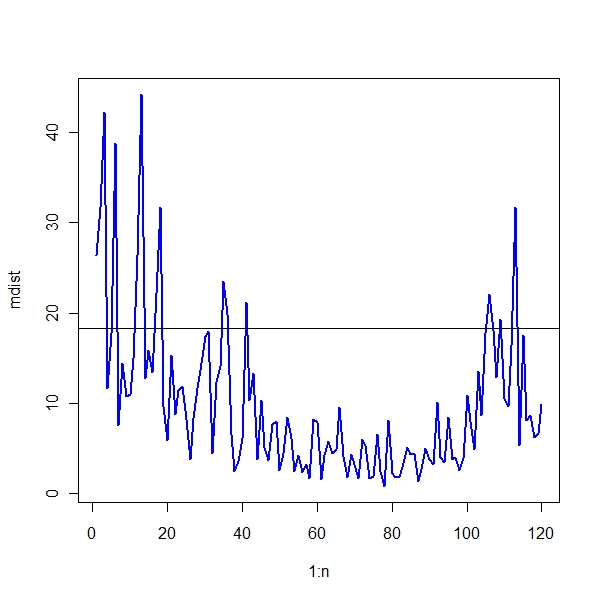
Again, consider the monthly log returns of the CRSP ten decile indices from January 2000 to December 2009. (a) Construct a T2-chart for the returns and
> folder <- "C:/Cauldron/Books/Statistics/Multivariate/TSAY/" > x <- read.table(paste(folder, "m-dec0009.txt", sep = ""), header = T) > x <- x[, -1] > x <- log(1 + x) > mu <- colMeans(x) > S <- cov(x) > S.inv <- solve(S) > n <- dim(x)[1] > mdist <- apply(x, 1, function(temp) t(temp - mu) %*% S.inv %*% + (temp - mu)) > plot(1:n, mdist, type = "l", lwd = 2, col = "blue") > abline(h = qchisq(0.95, 10)) |
(b) construct a T2-chart for future observations, starting with t = 60. Can one identify volatility periods using the control charts? Why?
> m <- 59 > n <- dim(x)[1] > y <- x[1:59, ] > z <- x[60:n, ] > p <- 10 > mu <- colMeans(y) > S <- cov(y) > S.inv <- solve(S) > n1 <- dim(z)[1] > mdist <- apply(z, 1, function(temp) t(temp - mu) %*% S.inv %*% + (temp - mu)) > plot(60:n, mdist, type = "l", lwd = 2, col = "blue") > ucl <- (n1 - 1) * p * qf(0.95, p, n1 - p)/(n1 - p) > abline(h = ucl) |