ColorBrewer
Purpose
To explore RColorBrewer package in R
Qualitative Schemes
Paired Scheme: Categories are visually related. Series of lightness pairs Accent Scheme: Use to accent small areas or important areas with colors that are more saturated / darker/lighter than others in the scheme
> library(RColorBrewer) > rand.data <- as.data.frame(replicate(8, rnorm(100, 100, sd = 1.5))) > colnames(rand.data) <- letters[1:8] |
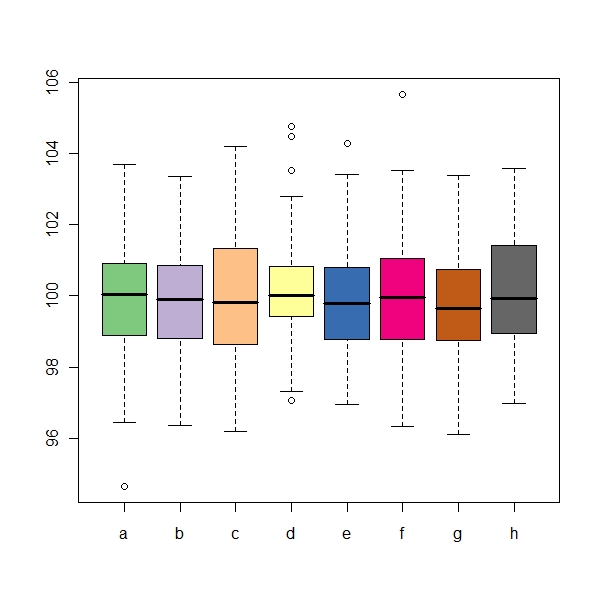
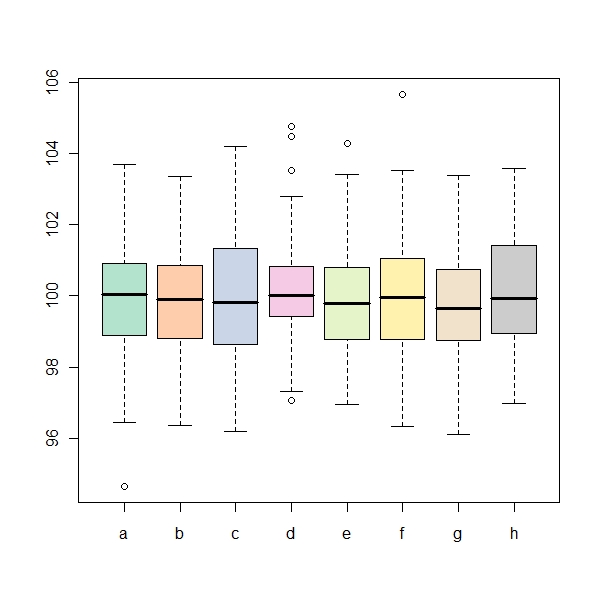
Accent
> boxplot((rand.data), col = brewer.pal(8, "Accent")) |
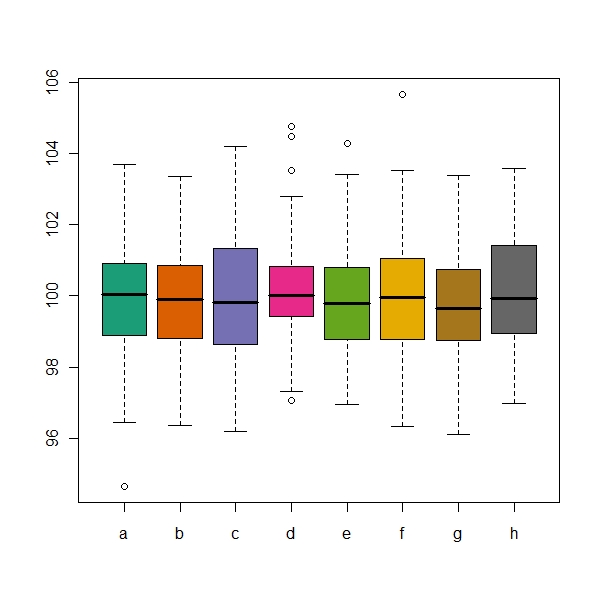
Dark2
> boxplot((rand.data), col = brewer.pal(8, "Dark2")) |
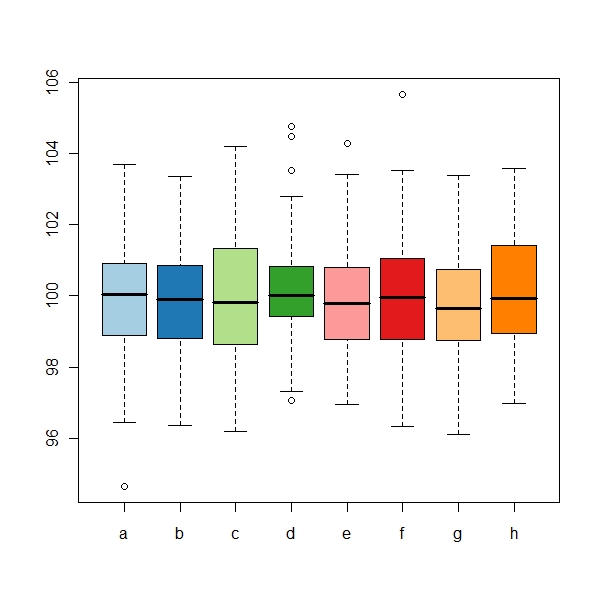
Paired
> boxplot((rand.data), col = brewer.pal(8, "Paired")) |
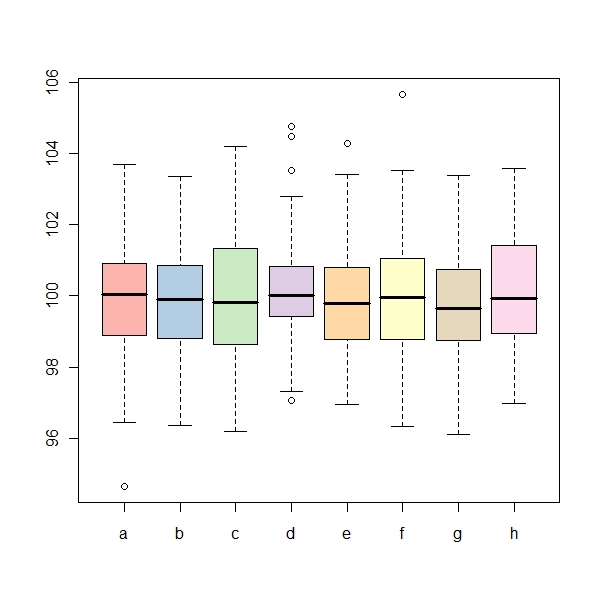
Pastel1
> boxplot((rand.data), col = brewer.pal(8, "Pastel1")) |
Pastel2
> boxplot((rand.data), col = brewer.pal(8, "Pastel2")) |
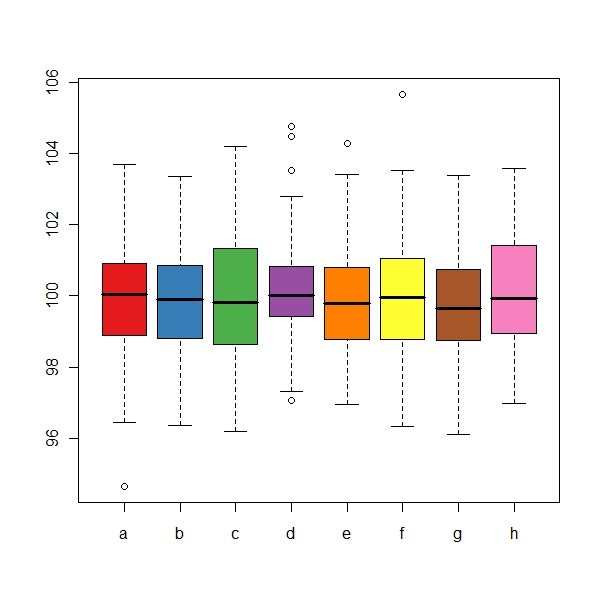
Set1
> boxplot((rand.data), col = brewer.pal(8, "Set1")) |
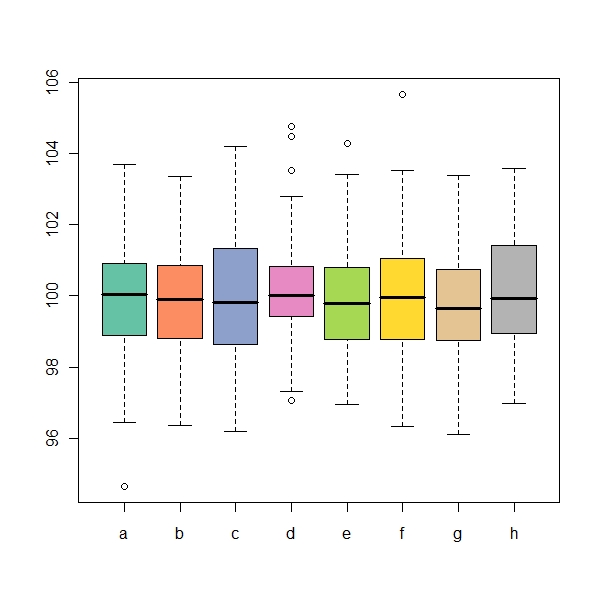
Set2
> boxplot((rand.data), col = brewer.pal(8, "Set2")) |
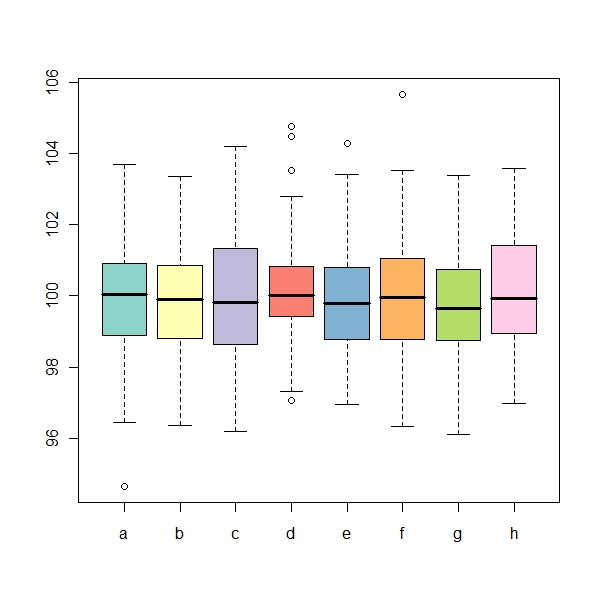
Set3
> boxplot((rand.data), col = brewer.pal(8, "Set3")) |
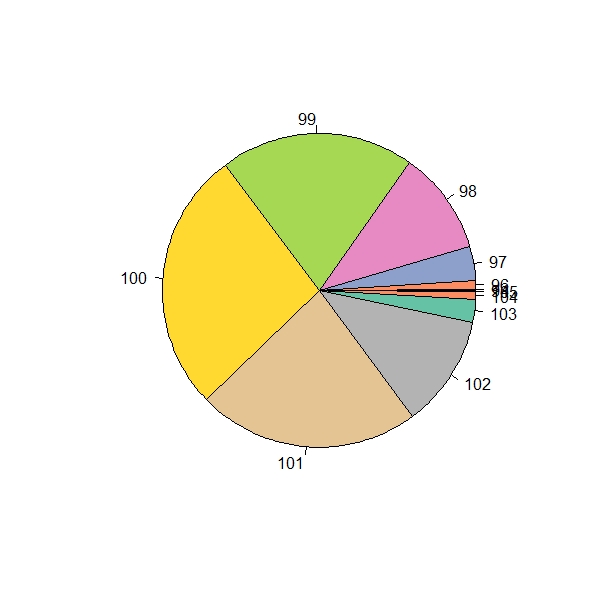
Pie Chart
> rand.data <- (replicate(8, rnorm(100, 100, sd = 1.5))) > table.data <- table(round(rand.data)) > pie(table.data, col = brewer.pal(8, "Set2")) |
Use of Sequential Pallete
> counts <- cbind(sort(runif(8)) * 10, sort(runif(8)) * 10, sort(runif(8)) * + 10) |
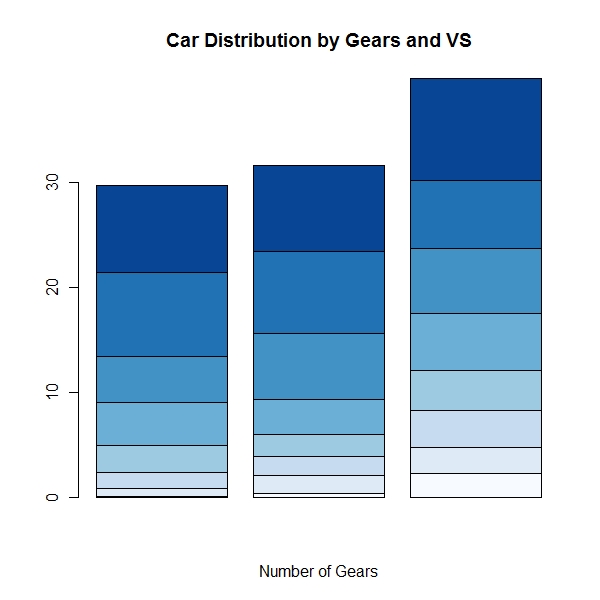
Blues
> barplot(counts, main = "Car Distribution by Gears and VS", xlab = "Number of Gears", + col = brewer.pal(8, "Blues"), ) |
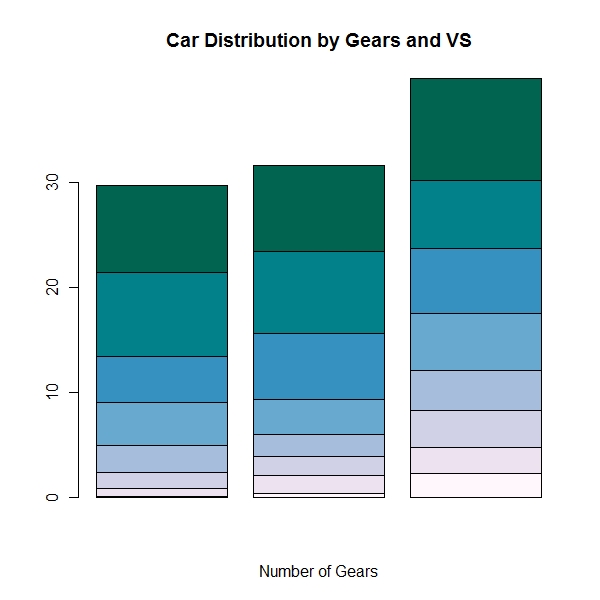
BuGn
> barplot(counts, main = "Car Distribution by Gears and VS", xlab = "Number of Gears", + col = brewer.pal(8, "BuGn"), ) |
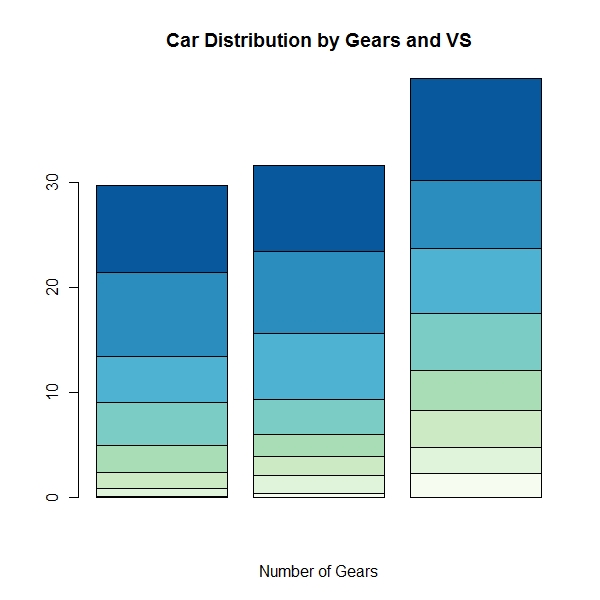
GnBu
> barplot(counts, main = "Car Distribution by Gears and VS", xlab = "Number of Gears", + col = brewer.pal(8, "GnBu"), ) |
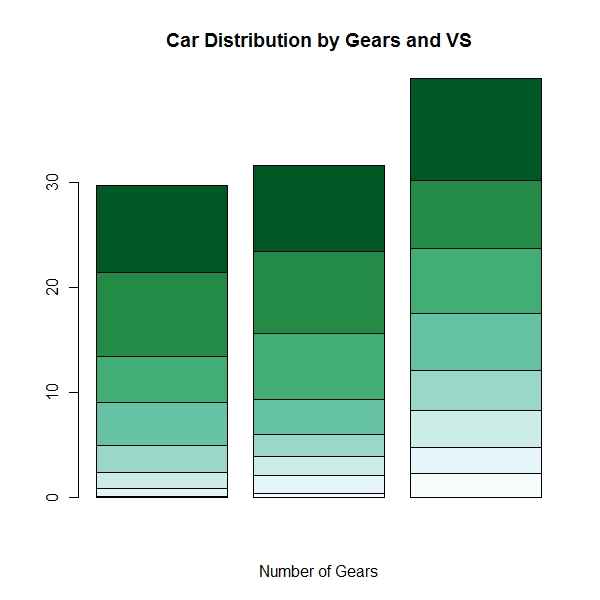
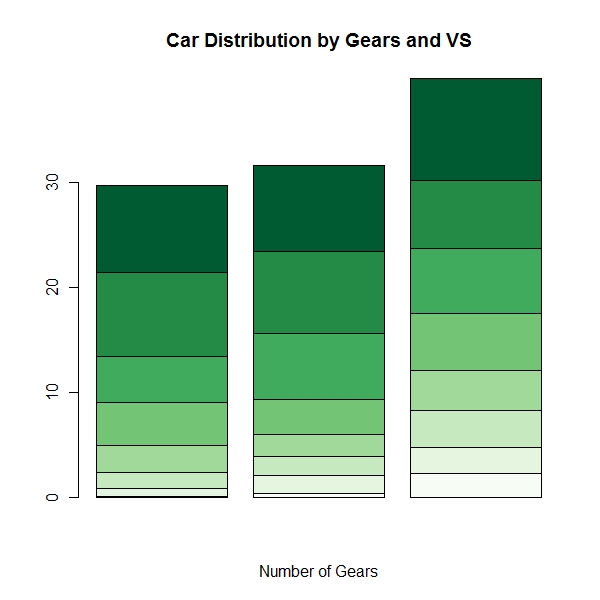
Greens
> barplot(counts, main = "Car Distribution by Gears and VS", xlab = "Number of Gears", + col = brewer.pal(8, "Greens"), ) |
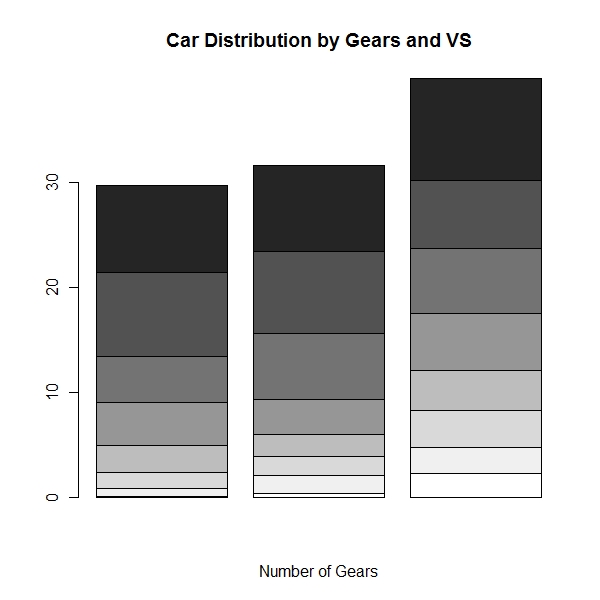
Greys
> barplot(counts, main = "Car Distribution by Gears and VS", xlab = "Number of Gears", + col = brewer.pal(8, "Greys"), ) |
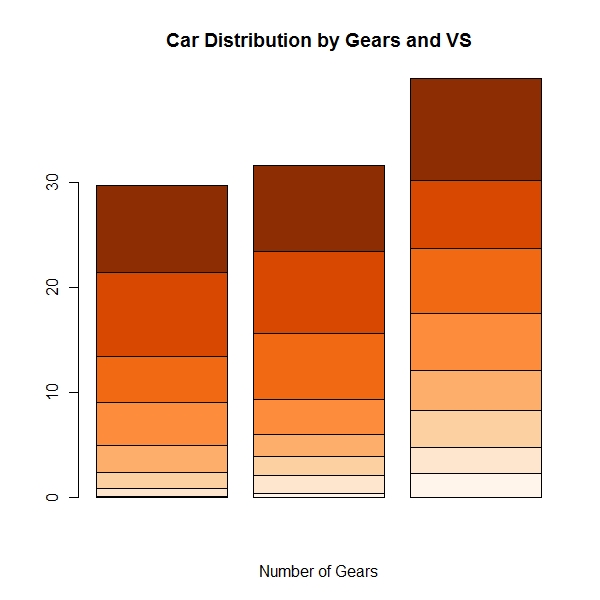
Oranges
> barplot(counts, main = "Car Distribution by Gears and VS", xlab = "Number of Gears", + col = brewer.pal(8, "Oranges"), ) |
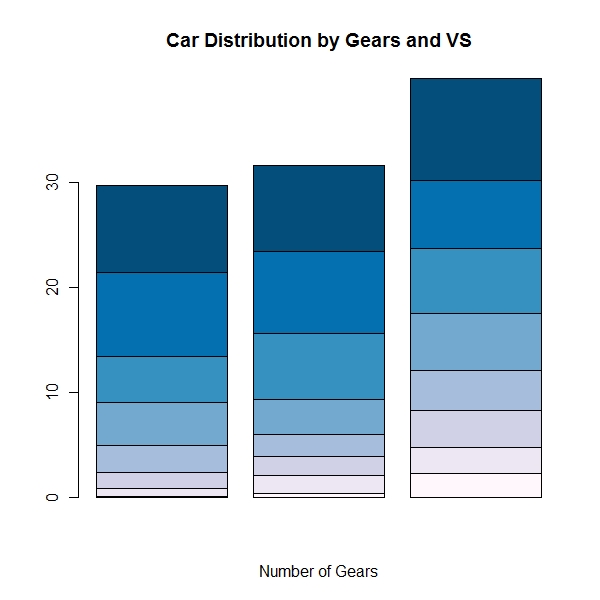
PuBu
> barplot(counts, main = "Car Distribution by Gears and VS", xlab = "Number of Gears", + col = brewer.pal(8, "PuBu"), ) |
PuBuGn
> barplot(counts, main = "Car Distribution by Gears and VS", xlab = "Number of Gears", + col = brewer.pal(8, "PuBuGn"), ) |
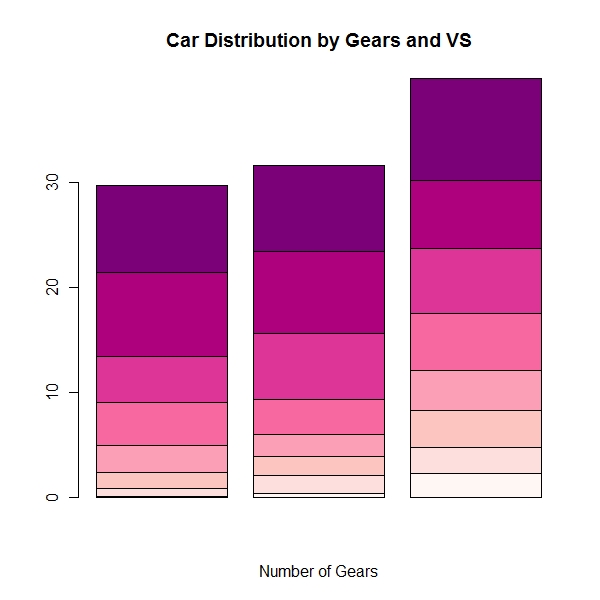
PuRd
> barplot(counts, main = "Car Distribution by Gears and VS", xlab = "Number of Gears", + col = brewer.pal(8, "PuRd"), ) |
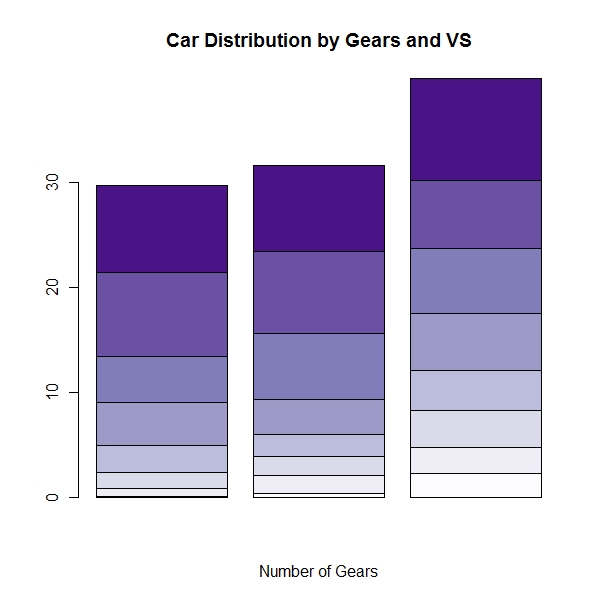
Purples
> barplot(counts, main = "Car Distribution by Gears and VS", xlab = "Number of Gears", + col = brewer.pal(8, "Purples"), ) |
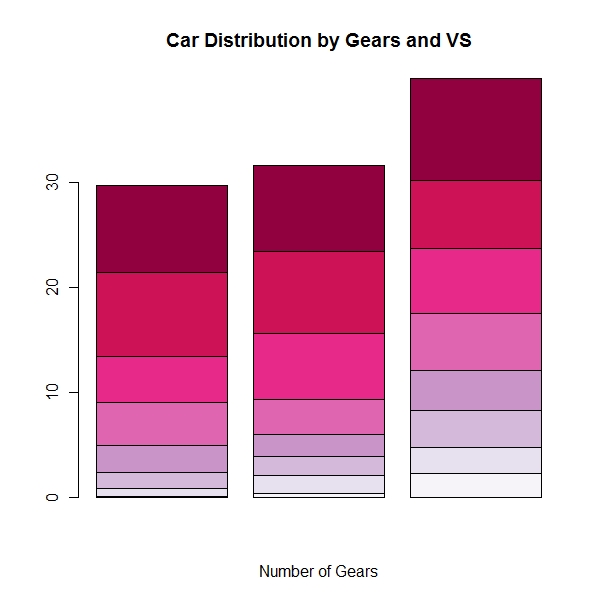
RdPu
> barplot(counts, main = "Car Distribution by Gears and VS", xlab = "Number of Gears", + col = brewer.pal(8, "RdPu"), ) |
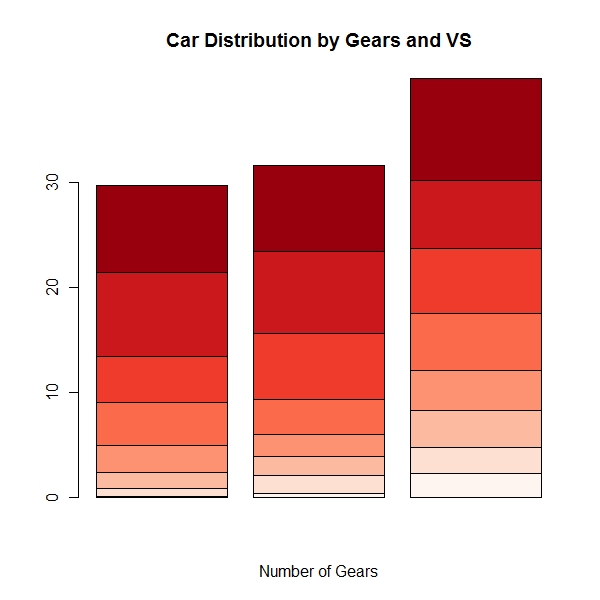
Reds
> barplot(counts, main = "Car Distribution by Gears and VS", xlab = "Number of Gears", + col = brewer.pal(8, "Reds"), ) |
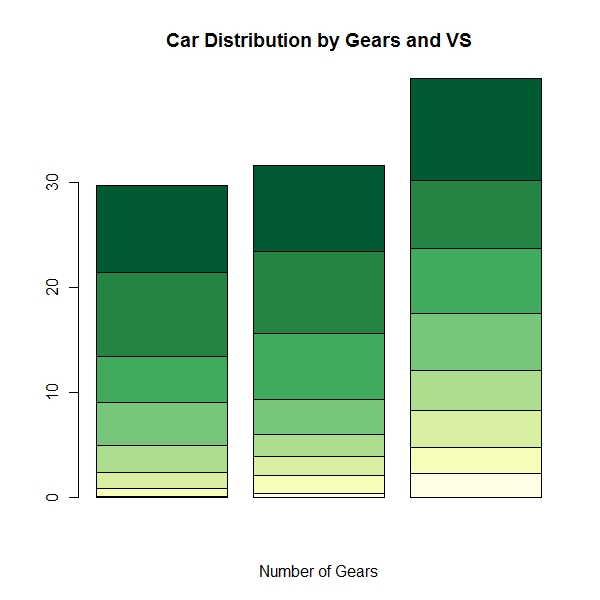
YlGn
> barplot(counts, main = "Car Distribution by Gears and VS", xlab = "Number of Gears", + col = brewer.pal(8, "YlGn"), ) |
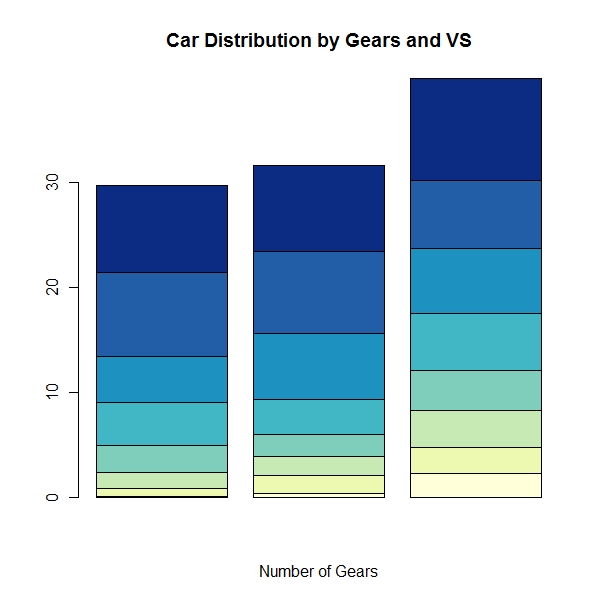
YlGnBu
> barplot(counts, main = "Car Distribution by Gears and VS", xlab = "Number of Gears", + col = brewer.pal(8, "YlGnBu"), ) |
YlOrBr
> barplot(counts, main = "Car Distribution by Gears and VS", xlab = "Number of Gears", + col = brewer.pal(8, "YlOrBr"), ) |

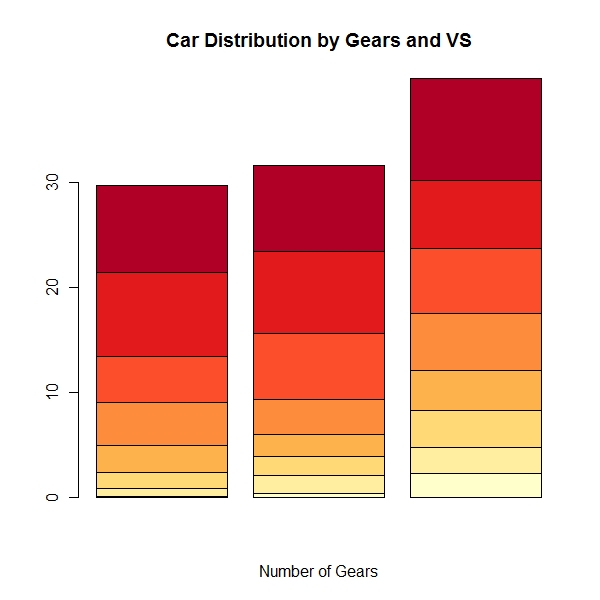
YlOrRd
> barplot(counts, main = "Car Distribution by Gears and VS", xlab = "Number of Gears", + col = brewer.pal(8, "YlOrRd"), ) |
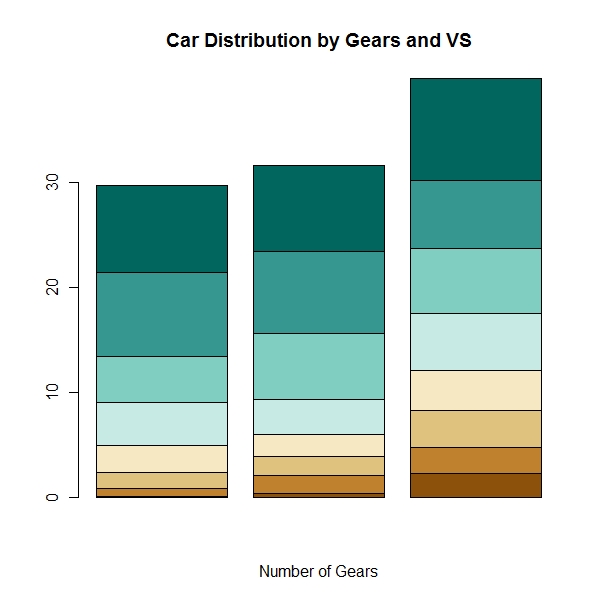
BrBG
> barplot(counts, main = "Car Distribution by Gears and VS", xlab = "Number of Gears", + col = brewer.pal(8, "BrBG"), ) |
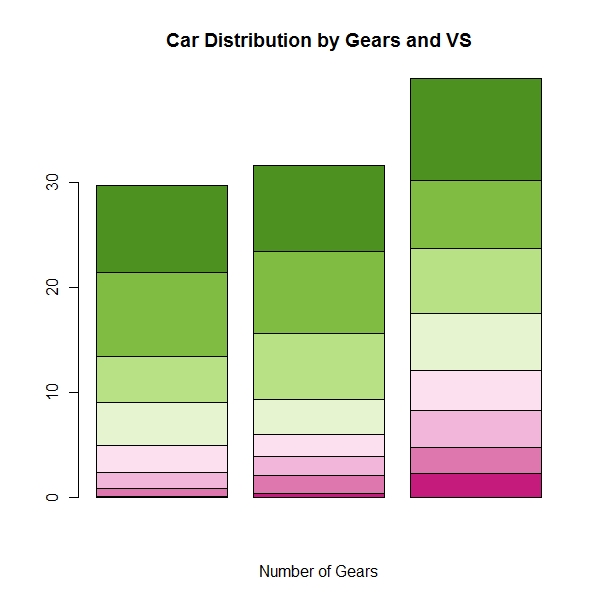
PiYG
> barplot(counts, main = "Car Distribution by Gears and VS", xlab = "Number of Gears", + col = brewer.pal(8, "PiYG"), ) |
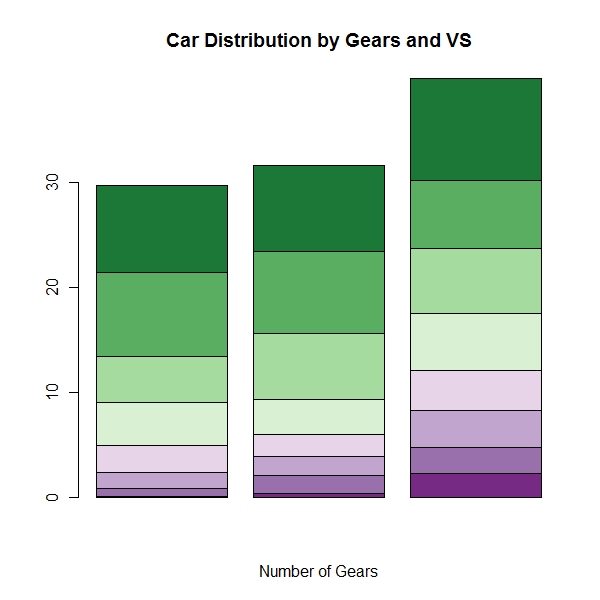
PRGn
> barplot(counts, main = "Car Distribution by Gears and VS", xlab = "Number of Gears", + col = brewer.pal(8, "PRGn"), ) |
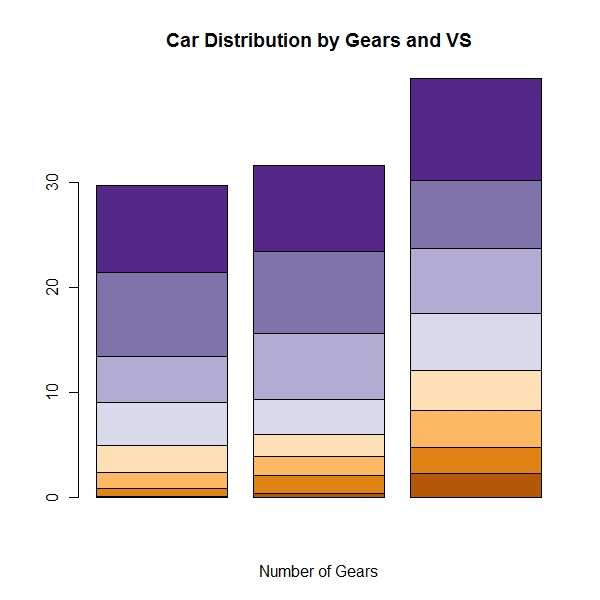
PuOr
> barplot(counts, main = "Car Distribution by Gears and VS", xlab = "Number of Gears", + col = brewer.pal(8, "PuOr"), ) |
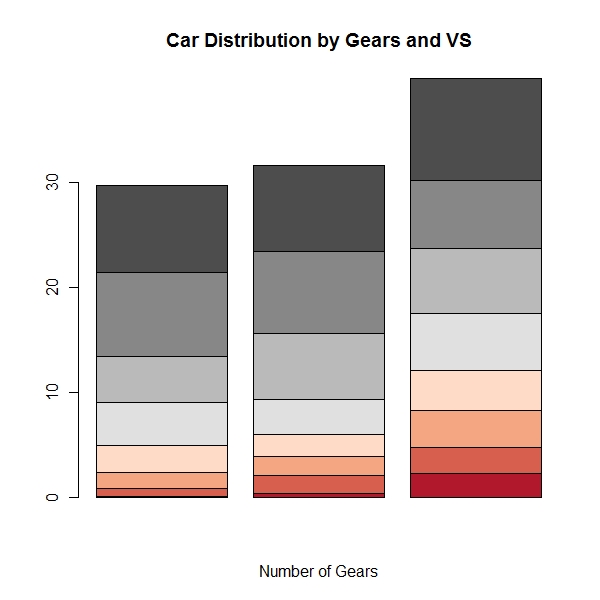
RdGy
> barplot(counts, main = "Car Distribution by Gears and VS", xlab = "Number of Gears", + col = brewer.pal(8, "RdGy"), ) |
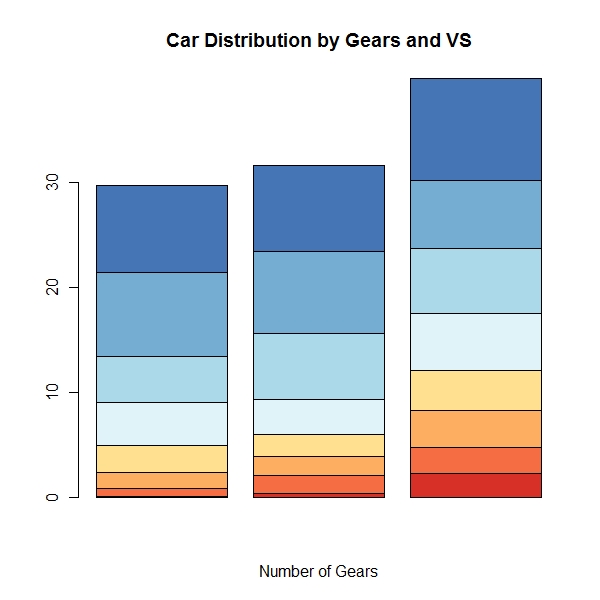
RdYlBu
> barplot(counts, main = "Car Distribution by Gears and VS", xlab = "Number of Gears", + col = brewer.pal(8, "RdYlBu"), ) |
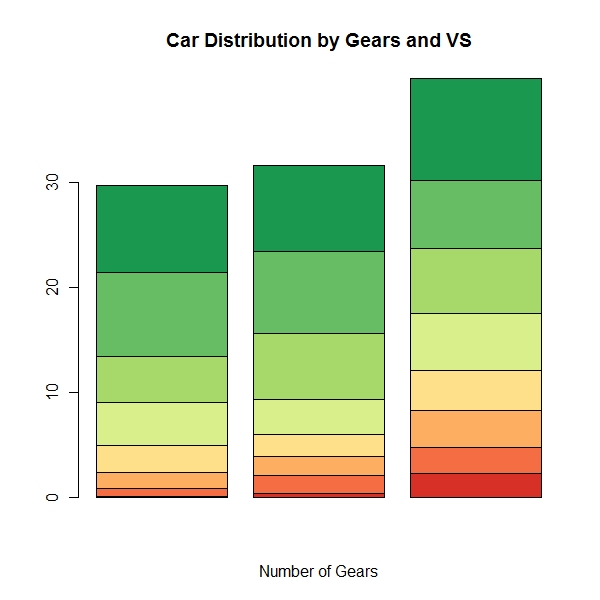
RdYlGn
> barplot(counts, main = "Car Distribution by Gears and VS", xlab = "Number of Gears", + col = brewer.pal(8, "RdYlGn"), ) |
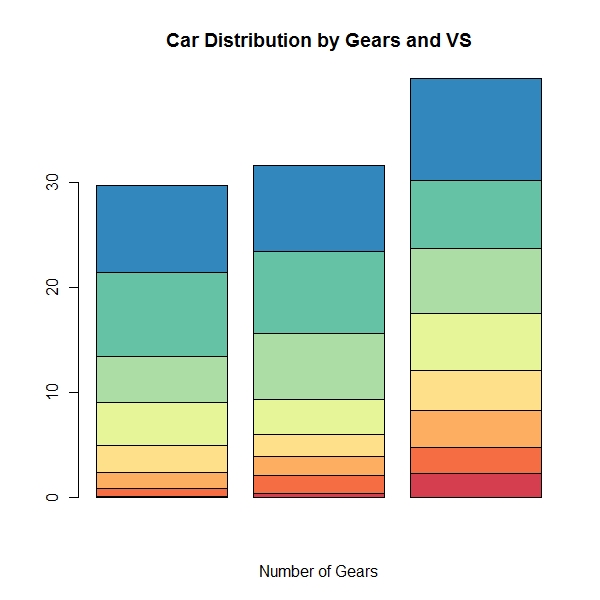
Spectral
> barplot(counts, main = "Car Distribution by Gears and VS", xlab = "Number of Gears", + col = brewer.pal(8, "Spectral"), ) |
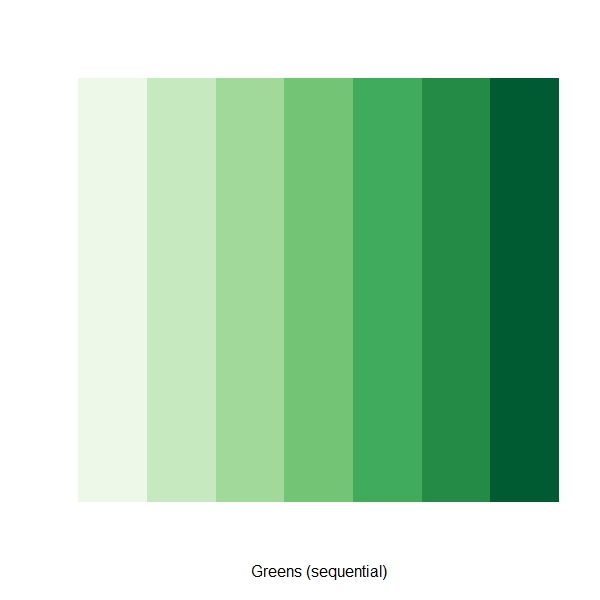
> mypalette <- brewer.pal(7, "Greens") > image(1:7, 1, as.matrix(1:7), col = mypalette, xlab = "Greens (sequential)", + ylab = "", xaxt = "n", yaxt = "n", bty = "n") |
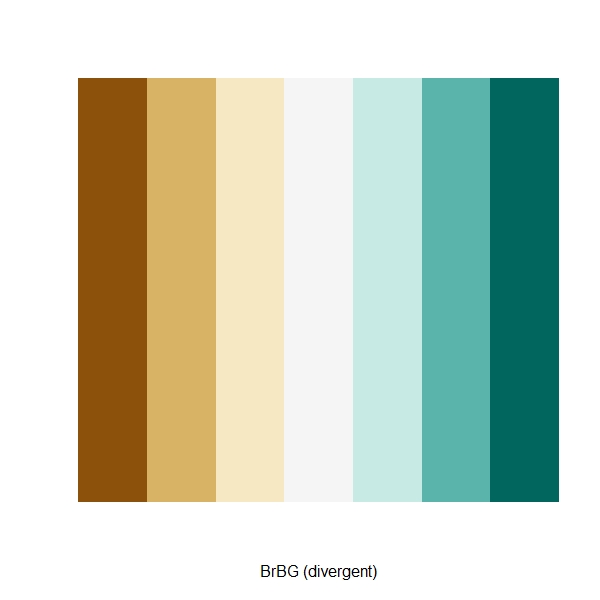
> display.brewer.pal(7, "BrBG") |
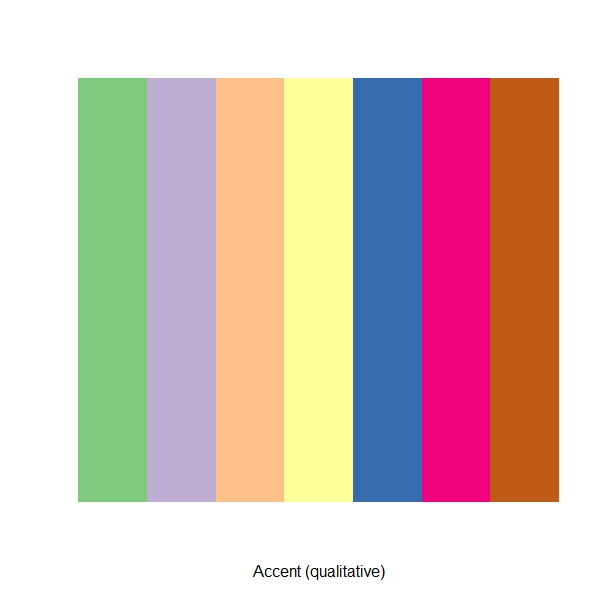
> display.brewer.pal(7, "Accent") |
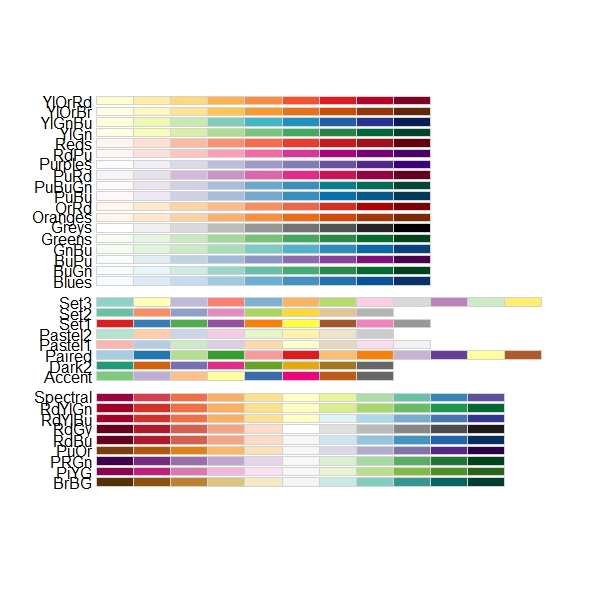
> display.brewer.all(n = 10, exact.n = FALSE) |
> display.brewer.all(n = 10) |
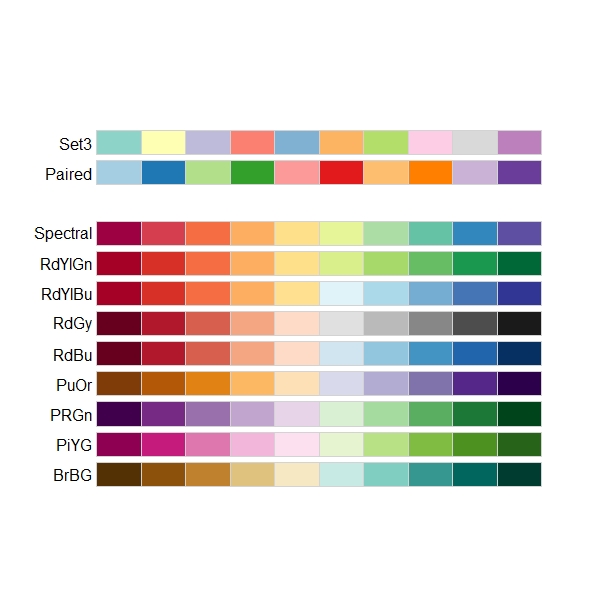
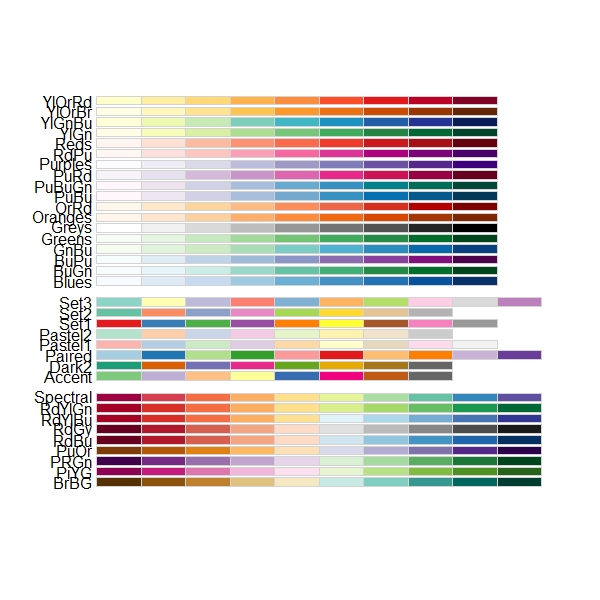
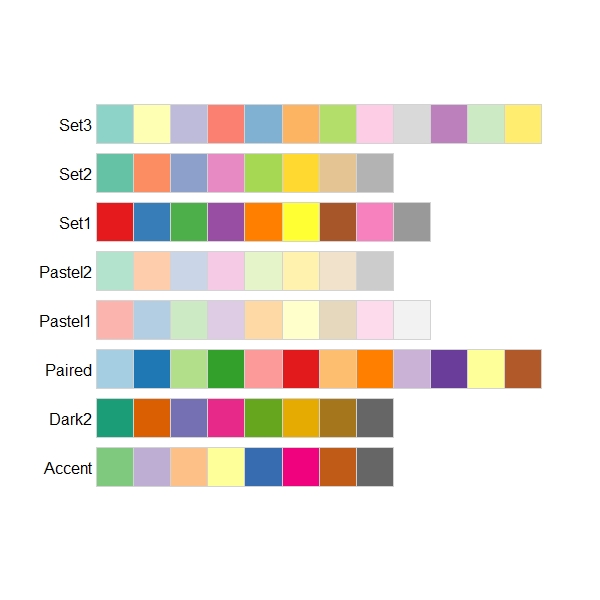
> display.brewer.all() |
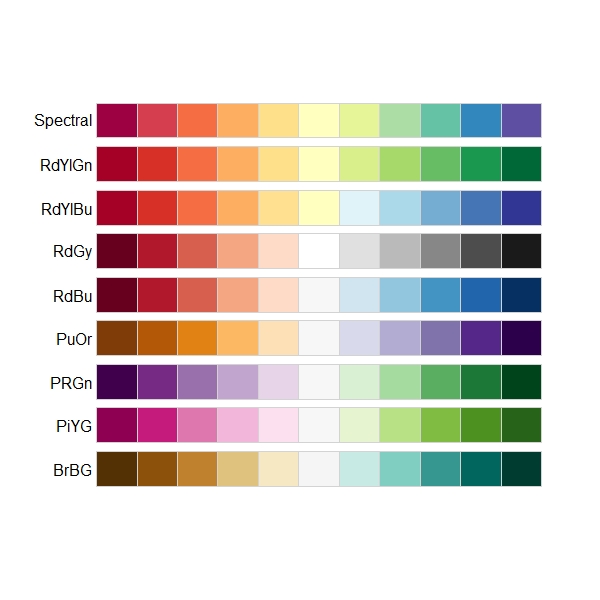
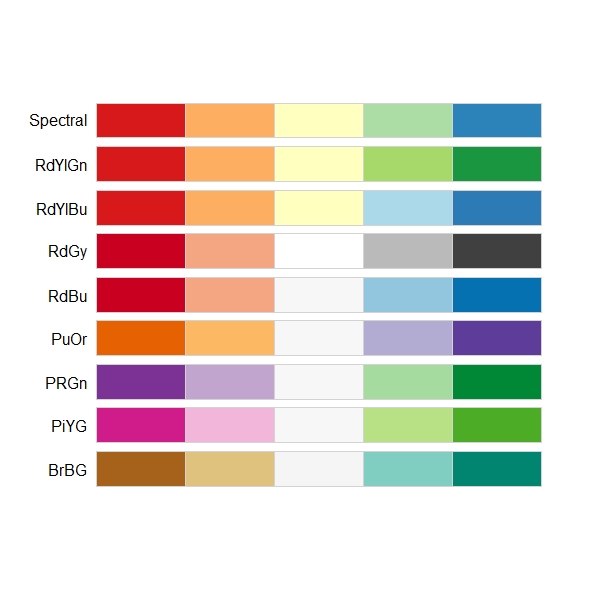
> display.brewer.all(type = "div") |
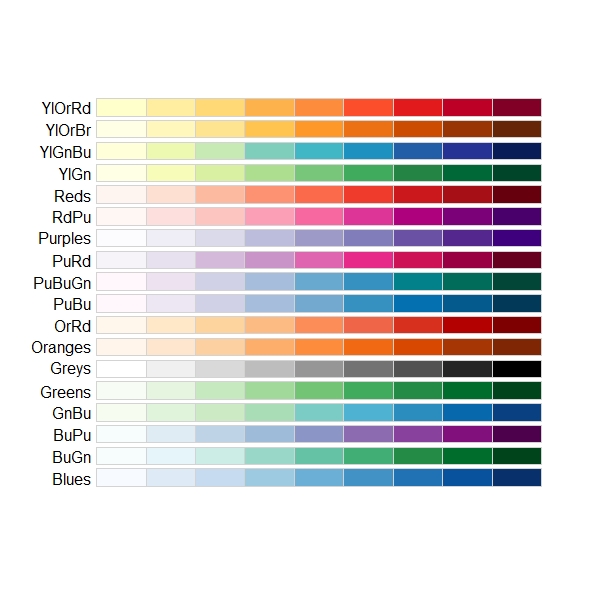
> display.brewer.all(type = "seq") |
> display.brewer.all(type = "qual") |
> display.brewer.all(n = 5, type = "div", exact.n = TRUE) |
> brewer.pal.info
         maxcolors category
BrBG            11      div
PiYG            11      div
PRGn            11      div
PuOr            11      div
RdBu            11      div
RdGy            11      div
RdYlBu          11      div
RdYlGn          11      div
Spectral        11      div
Accent           8     qual
Dark2            8     qual
Paired          12     qual
Pastel1          9     qual
Pastel2          8     qual
Set1             9     qual
Set2             8     qual
Set3            12     qual
Blues            9      seq
BuGn             9      seq
BuPu             9      seq
GnBu             9      seq
Greens           9      seq
Greys            9      seq
Oranges          9      seq
OrRd             9      seq
PuBu             9      seq
PuBuGn           9      seq
PuRd             9      seq
Purples          9      seq
RdPu             9      seq
Reds             9      seq
YlGn             9      seq
YlGnBu           9      seq
YlOrBr           9      seq
YlOrRd 9 seq |
> brewer.pal.info["Blues", ]
      maxcolors category
Blues 9 seq |
> brewer.pal.info["Blues", ]$maxcolors [1] 9 |