Bressound II - 1.1
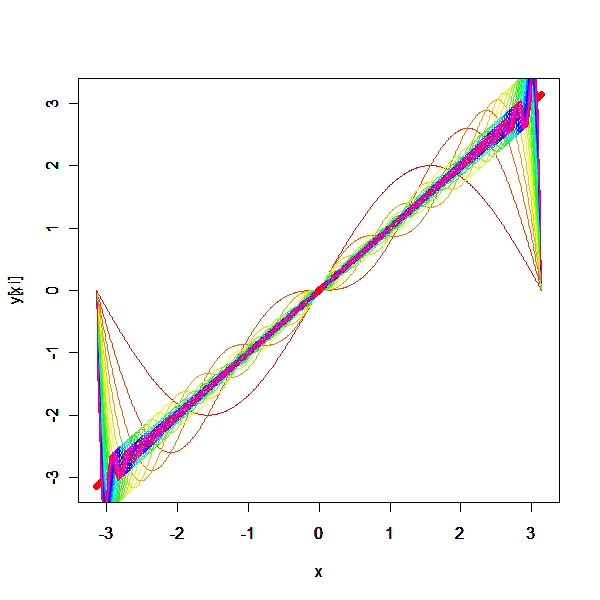
Fourier Series Exp
f(x) = x
> x <- seq(-pi, pi, 0.01)
> y <- matrix(data = NA, ncol = 100, nrow = length(x))
> for (i in 1:ncol(y)) {
+     temp <- sin(i * x) * 2/i * (-1)^(i + 1)
+     if (i > 1) {
+         y[, i] <- y[, (i - 1)] + temp
+     }
+     else {
+         y[, i] <- temp
+     }
+ }
> cols <- rainbow(30)
> par(mfrow = c(1, 1))
> plot.new()
> plot(x, x, ylim = c(-pi, pi), pch = 19, xlim = c(-pi, pi), col = "red")
> par(new = T)
> i <- 1
> for (i in 1:30) {
+     plot(x, y[, i], col = cols[i], ylim = c(-pi, pi), type = "l",
+         lty = "solid", xlim = c(-pi, pi))
+     par(new = T)
+ }
> par(new = F) |
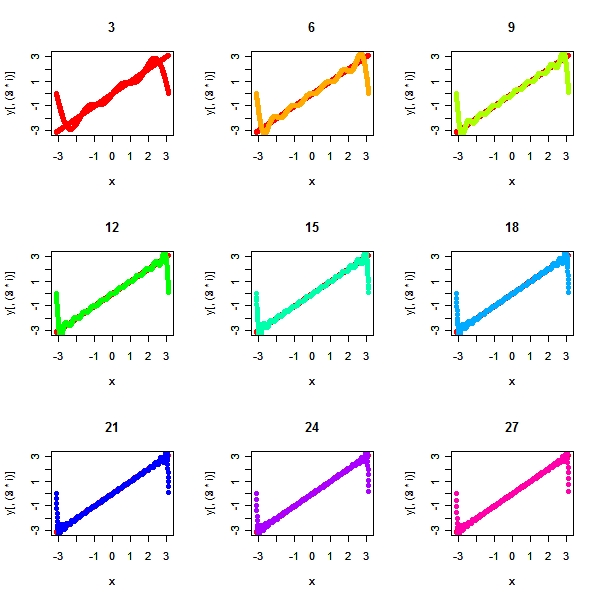
Fourier Series Convergence
for n = seq(3,27,3)
> cols <- rainbow(9)
> par(mfrow = c(3, 3))
> i <- 1
> for (i in 1:9) {
+     plot(x, x, ylim = c(-pi, pi), pch = 19, xlim = c(-pi, pi),
+         col = "red", main = 3 * i)
+     par(new = T)
+     plot(x, y[, (3 * i)], col = cols[i], ylim = c(-pi, pi), pch = 19,
+         xlim = c(-pi, pi))
+     par(new = F)
+ } |
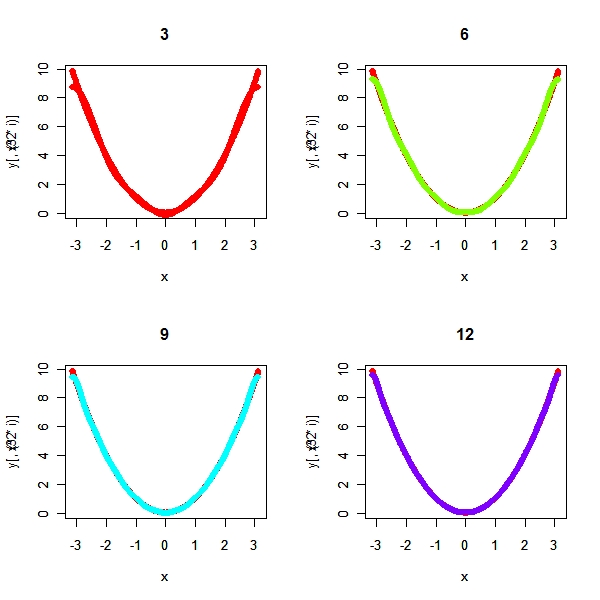
f(x) = x^2
> x <- seq(-pi, pi, 0.01)
> y <- matrix(data = NA, ncol = 100, nrow = length(x))
> for (i in 1:ncol(y)) {
+     temp <- cos(i * x) * (4/(i^2)) * (-1)^(i)
+     if (i > 1) {
+         y[, i] <- y[, (i - 1)] + temp
+     }
+     else {
+         y[, i] <- temp + pi^2/3
+     }
+ }
> cols <- rainbow(4)
> par(mfrow = c(2, 2))
> i <- 1
> for (i in 1:4) {
+     plot(x, x^2, ylim = c(0, pi^2), pch = 19, xlim = c(-pi, pi),
+         col = "red", main = 3 * i)
+     par(new = T)
+     plot(x, y[, (3 * i)], col = cols[i], ylim = c(0, pi^2), pch = 19,
+         xlim = c(-pi, pi))
+     par(new = F)
+ } |