RGraphics - Chapter 3 - 1
Purpose
To use grid to replicate base graphics
This is present in Paul Murrell’s book
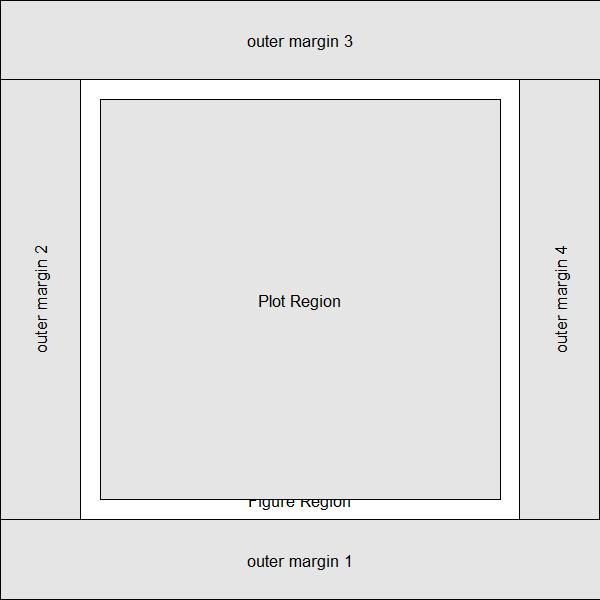
> par(oma = rep(3, 4), bg = "grey80")
> plot(c(0, 1), c(0, 1), type = "n", ann = FALSE, axes = FALSE)
> box("outer", col = "grey")
> par(xpd = TRUE)
> rect(-1, -1, 2, 2, col = "grey90")
> box("figure")
> par(xpd = FALSE)
> rect(-1, -1, 2, 2, col = "grey80")
> box("plot", lty = "dashed")
> text(0.5, 0.5, "Plot Region")
> mtext("Figure Region", side = 3, line = 2)
> for (i in 1:4) mtext(paste("Outer margin", i), side = i, line = 1,
+ outer = TRUE) |
I managed to get this using Rgrid
> library(grid)
> vlayout1 <- grid.layout(3, 1, heights = unit(c(4, 1, 4), c("lines",
+     "null", "lines")), )
> top.vp1 <- viewport(layout = vlayout1)
> top.vp2 <- viewport(layout = vlayout2)
> margin1 <- viewport(layout.pos.col = 1, layout.pos.row = 1, name = "margin11")
> margin2 <- viewport(layout.pos.col = 1, layout.pos.row = 2, name = "margin21")
> margin3 <- viewport(layout.pos.col = 1, layout.pos.row = 3, name = "margin31")
> splot1 <- vpTree(top.vp1, vpList(margin1, margin2, margin3))
> grid.newpage()
> pushViewport(splot1)
> seekViewport("margin11")
> grid.rect(gp = gpar(fill = "grey90"))
> grid.text(label = "outer margin 3", rot = 0)
> seekViewport("margin31")
> grid.rect(gp = gpar(fill = "grey90"))
> grid.text(label = "outer margin 1", rot = 0)
> seekViewport("margin21")
> grid.rect(gp = gpar(fill = "white"))
> vlayout2 <- grid.layout(1, 3, widths = unit(c(4, 1, 4), c("lines",
+     "null", "lines")), )
> pushViewport(viewport(layout = vlayout2))
> pushViewport(viewport(layout.pos.col = 1, layout.pos.row = 1))
> grid.rect(gp = gpar(fill = "grey90"))
> grid.text(label = "outer margin 2", rot = 90)
> upViewport()
> pushViewport(viewport(layout.pos.col = 3, layout.pos.row = 1))
> grid.rect(gp = gpar(fill = "grey90"))
> grid.text(label = "outer margin 4", rot = 90)
> upViewport()
> pushViewport(viewport(layout.pos.col = 2, layout.pos.row = 1))
> grid.text("Figure Region", x = unit(0.5, "npc"), y = unit(1,
+     "lines"))
> pushViewport(viewport(x = 0.5, y = 0.5, width = unit(4, "inches"),
+     height = unit(4, "inches")))
> grid.rect(gp = gpar(fill = "grey90"))
> grid.text("Plot Region")
> upViewport() |