Poisson Process
Purpose
To generate poisson sample paths and explore density, cumulative density and view sample realizations of the poisson process
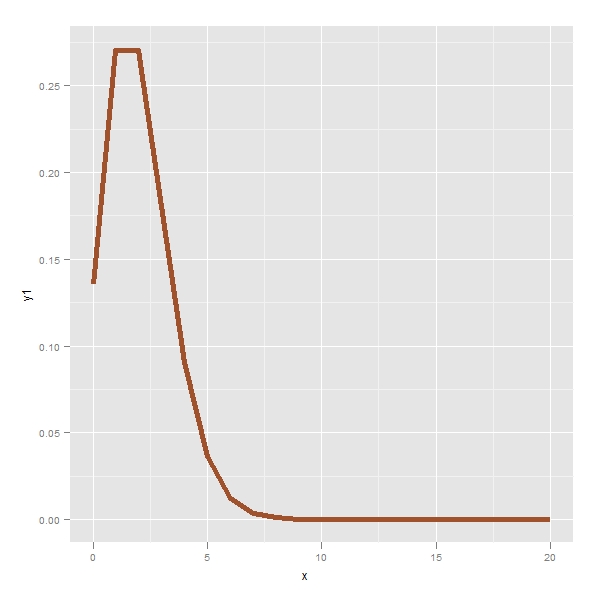
> library(ggplot2) > n <- 20 > lambda <- 2 > z <- data.frame(x = 0:n, y1 = dpois(0:n, lambda), y2 = ppois(0:n, + lambda)) > p <- ggplot(z, aes(x = x)) > q1 <- p + geom_line(aes(y = y1), col = "sienna", lwd = 2) > q2 <- p + geom_line(aes(y = y2), col = "sienna", lwd = 2) |
Density
> print(q1) |
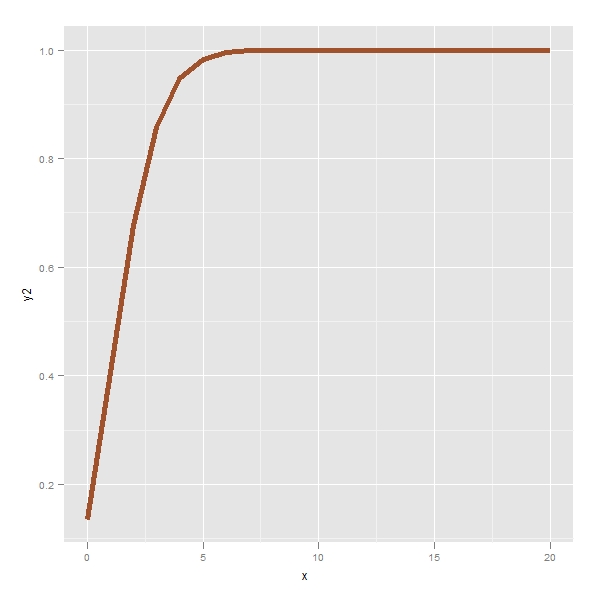
Cumulative Density
> print(q2) |
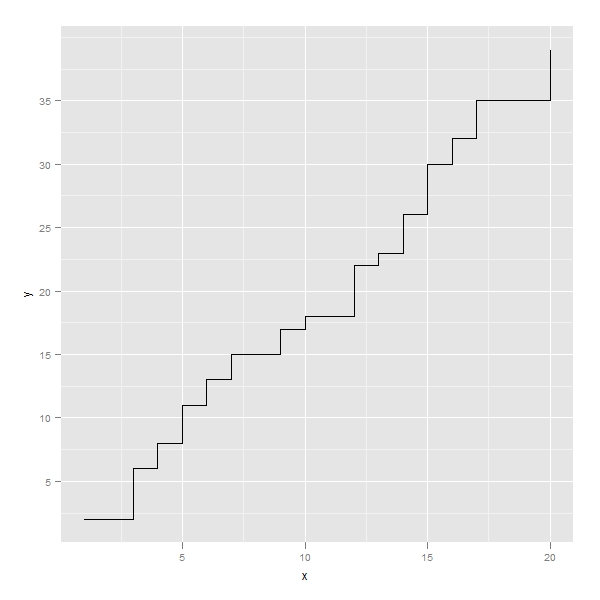
One poisson Sample path
> sample.path <- data.frame(x = 1:20, y = cumsum(rpois(20, 2))) > p <- ggplot(sample.path, aes(x = x)) > q3 <- p + geom_step(aes(y = y)) > print(q3) |
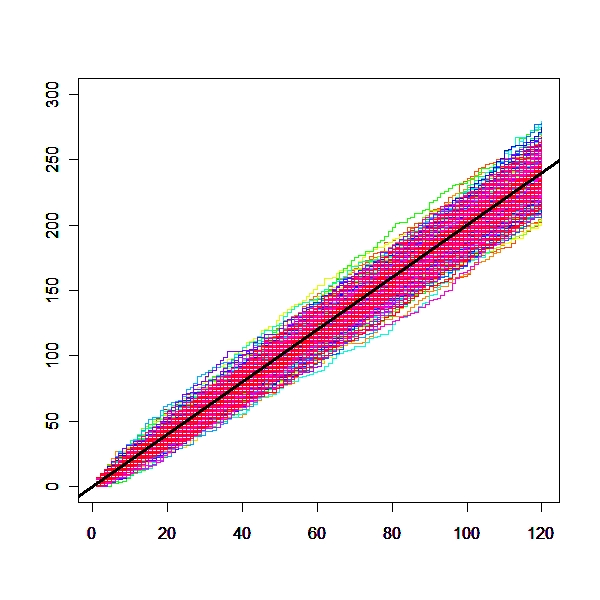
Sample poisson paths with the mean line overlaid
> cols = rainbow(400)
> for (i in 1:400) {
+     plot(1:120, cumsum(rpois(120, 2)), type = "s", ylim = c(0,
+         300), col = cols[i], ylab = "", xlab = "")
+     par(new = T)
+ }
> abline(0, lambda, col = "black", lwd = 3) |