Scatterplot
Purpose
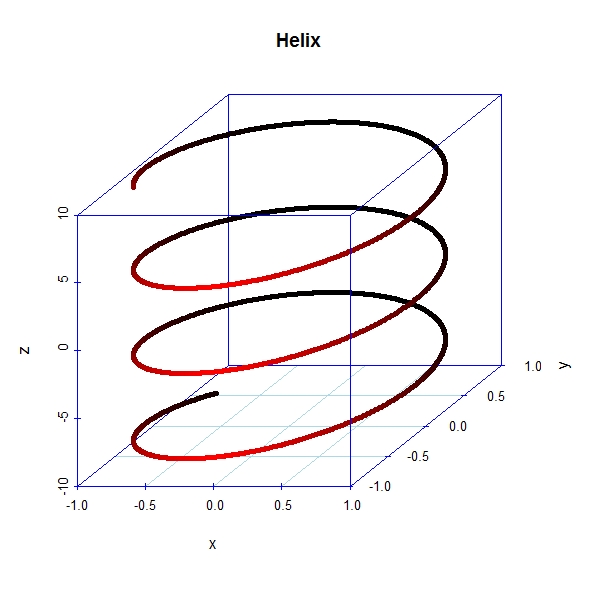
To deep practice Scatterplot3d package .Helix
> par(mfrow = c(1, 1)) > library(scatterplot3d) > z <- seq(-10, 10, 0.01) > x <- cos(z) > y <- sin(z) > scatterplot3d(x, y, z, highlight.3d = TRUE, col.axis = "blue", + col.grid = "lightblue", main = "Helix", pch = 20) |
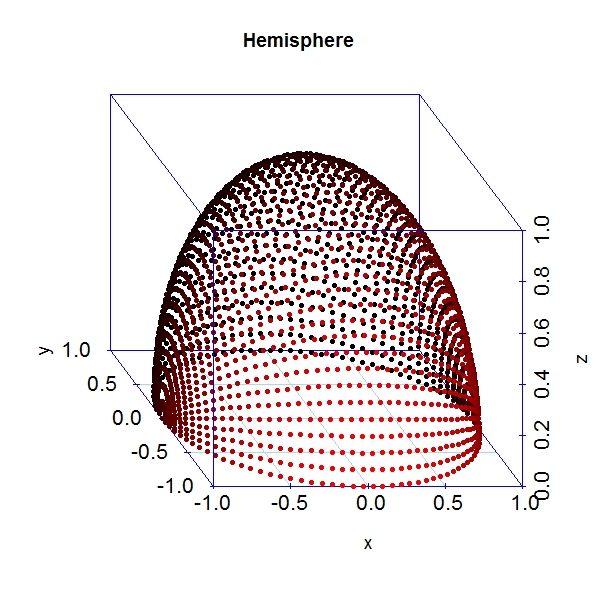
Hemisphere
> par(mfrow = c(1, 1)) > temp <- seq(-pi, 0, length = 50) > x <- c(rep(1, 50) %*% t(cos(temp))) > y <- c(cos(temp) %*% t(sin(temp))) > z <- c(sin(temp) %*% t(sin(temp))) > scatterplot3d(x, y, z, highlight.3d = TRUE, angle = 120, col.axis = "blue", + col.grid = "lightblue", cex.axis = 1.3, cex.lab = 1.1, main = "Hemisphere", + pch = 20) |
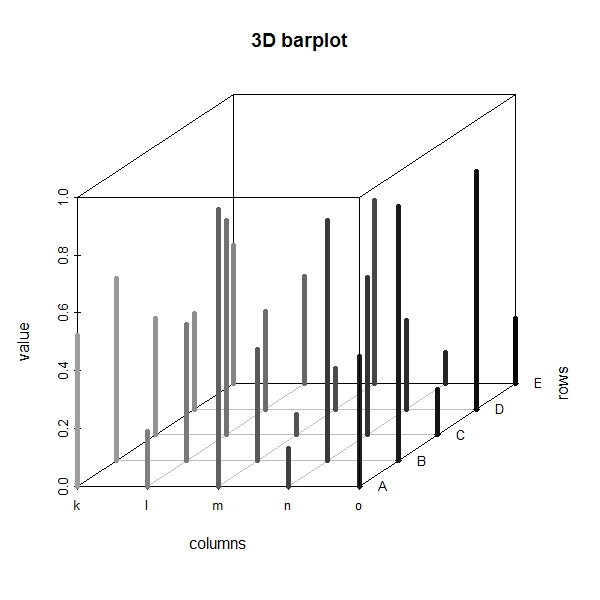
3DPlot
> par(mfrow = c(1, 1)) > my.mat <- matrix(runif(25), nrow = 5) > dimnames(my.mat) <- list(LETTERS[1:5], letters[11:15]) > s3d.dat <- data.frame(columns = c(col(my.mat)), rows = c(row(my.mat)), + value = c(my.mat)) > scatterplot3d(s3d.dat, type = "h", lwd = 5, pch = " ", x.ticklabs = colnames(my.mat), + y.ticklabs = rownames(my.mat), color = grey(25:1/40), main = "3D barplot") |
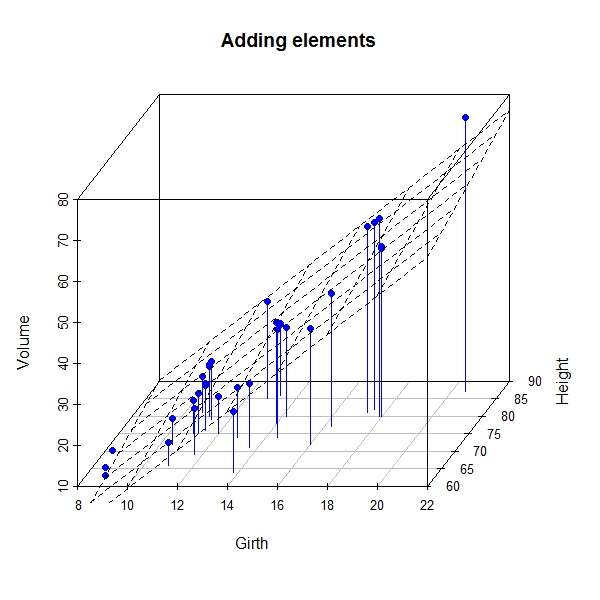
Adding elements
> data(trees) > s3d <- scatterplot3d(trees, type = "h", color = "blue", angle = 55, + scale.y = 0.7, pch = 16, main = "Adding elements") > my.lm <- lm(trees$Volume ~ trees$Girth + trees$Height) > s3d$plane3d(my.lm) |
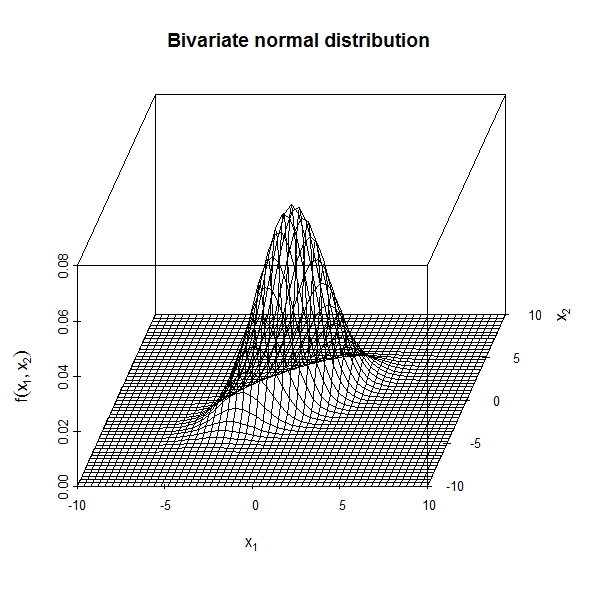
Bivariate Normal Distribution uses persp plot and scatterplot3d
> library(mvtnorm) > x1 <- x2 <- seq(-10, 10, length = 51) > dens <- matrix(dmvnorm(expand.grid(x1, x2), sigma = rbind(c(3, + 2), c(2, 3))), ncol = length(x1)) > s3d <- scatterplot3d(x1, x2, seq(min(dens), max(dens), length = length(x1)), + type = "n", grid = FALSE, angle = 70, zlab = expression(f(x[1], + x[2])), xlab = expression(x[1]), ylab = expression(x[2]), + main = "Bivariate normal distribution") > for (i in length(x1):1) s3d$points3d(rep(x1[i], length(x2)), + x2, dens[i, ], type = "l") > for (i in length(x2):1) s3d$points3d(x1, rep(x2[i], length(x1)), + dens[, i], type = "l") |