ANOVA
Purpose : To do some worked out examples of ANOVA and MANOVA
> library(HSAUR2) > library(ggplot2) |
> mydata <- weightgain |
Exploratory Analysis
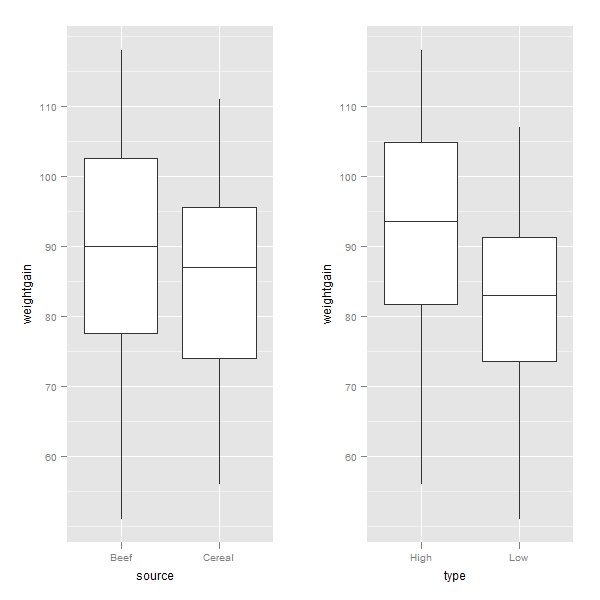
> qplot(type, weightgain, data = mydata, geom = "jitter") > qplot(type, weightgain, data = mydata, geom = "boxplot") > q1 <- qplot(source, weightgain, data = mydata, geom = "boxplot") > q2 <- qplot(type, weightgain, data = mydata, geom = "boxplot") > pushViewport(viewport(layout = grid.layout(1, 2))) > vplayout <- function(x, y) viewport(layout.pos.row = x, layout.pos.col = y) > print(q1, vp = vplayout(1, 1)) > print(q2, vp = vplayout(1, 2)) |
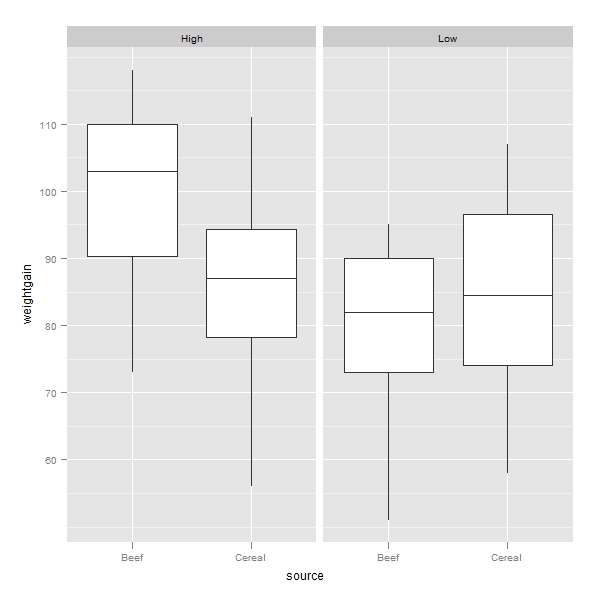
> q3 <- qplot(source, weightgain, data = mydata, facets = . ~ type, + geom = "boxplot") > print(q3) |

> temp1 <- ddply(mydata, c("source"), function(x) mean(x$weightgain))
> temp2 <- ddply(mydata, c("type"), function(x) mean(x$weightgain))
> temp3 <- ddply(mydata, c("type", "source"), function(x) mean(x$weightgain))
> temp1
  source   V1
1   Beef 89.6
2 Cereal 84.9
> temp2
  type    V1
1 High 92.95
2  Low 81.55
> temp3
  type source    V1
1 High   Beef 100.0
2 High Cereal  85.9
3  Low   Beef  79.2
4 Low Cereal 83.9 |

> q3 <- qplot(source, weightgain, data = mydata, facets = . ~ type, + geom = "boxplot") > print(q3) |
Check equality of variances
> temp4 <- ddply(mydata, c("type", "source"), function(x) sd(x$weightgain))
> temp4
  type source       V1
1 High   Beef 15.13642
2 High Cereal 15.02184
3  Low   Beef 13.88684
4 Low Cereal 15.70881 |
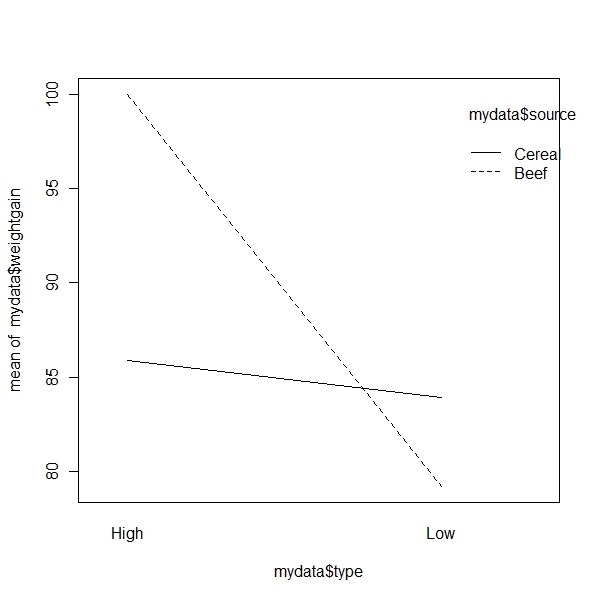
> interaction.plot(mydata$type, mydata$source, mydata$weightgain) |
> fit <- aov(weightgain ~ source * type, mydata)
> summary(fit)
            Df Sum Sq Mean Sq F value  Pr(>F)
source       1  220.9   220.9  0.9879 0.32688
type         1 1299.6  1299.6  5.8123 0.02114 *
source:type  1  883.6   883.6  3.9518 0.05447 .
Residuals   36 8049.4   223.6
---
Signif. codes: 0 '***' 0.001 '**' 0.01 '*' 0.05 '.' 0.1 ' ' 1 |
> fit <- aov(weightgain ~ source * type, mydata, contrasts = list(source = contr.sum))
> coef(fit)
    (Intercept)         source1         typeLow source1:typeLow
92.95 7.05 -11.40 -9.40 |