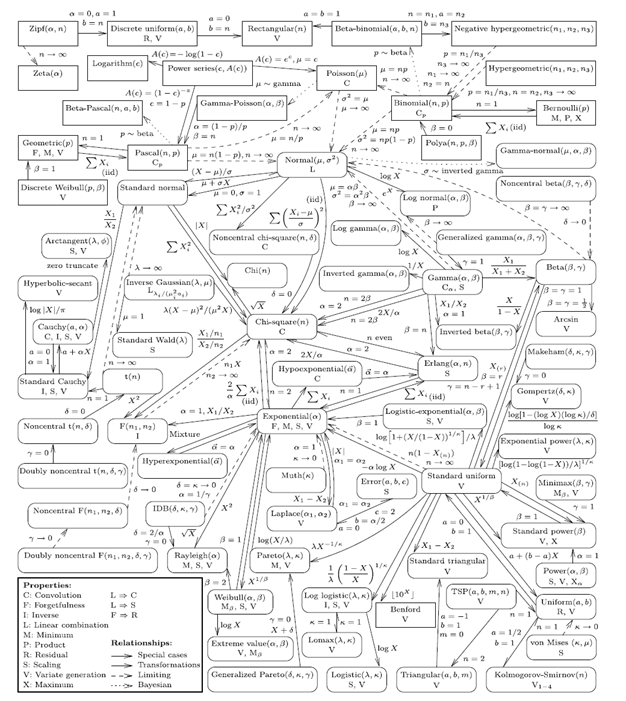
Univariate Distribution Relationships
There are a ton of relationships between various distributions. One typically understands them, remembers them based on the kind of stats work that one does. If one does a lot of Bayesian stuff, one tends to remember the conjugate priors and related distributions. If you are doing survival modeling, you tend to focus on specific distributions like weibull etc. If you are in to OR work, Erlang, gamma, beta distribution parameters are at your finger tips. Irrespective of the type of analysis that one does, it is always good to have a decent overview of various random variables and the connections between them. The connections that one must understand should typically encompass :
-
If I am given a random variable from a distribution F1, How do I generate a random variable with distribution F2 ?
-
Does a distribution F1, tend to another distribution in the limiting case involving one of the parameters ?
-
If you take a convolution of random variables belonging to a specific family of distribution, does the resulting variable belong to the same family ?
-
What if you scale a random variable, Does the distribution change ? What if you invert ?
-
What if you take a min or max of sample data from a distribution ,Does the resulting statistic belong to the same distribution family ?
-
Is the conditional density of a random variable same as unconditional density of the random variable ?
-
Does a linear combination of random variables from a family result in a variable that belongs to the same family ?
-
Does the CDF allow you to do inverse transformation ( for simulation purpose)
Answering the above questions for the various distributions and more importantly remembering them is a challenging task,at least to me. Recently I stumbled on to a fantastic visual from The American Statistician that summarizes the relationships between 76 univariate distributions that includes 57 continuous probability distributions and 19 discrete probability distributions. Tremendous effort seems to have gone behind making this visual. By merely looking at various segments of the visual, you will get to learn and remember the deep connections between the various probability distributions. If you work out the relations using pen and paper, then you will tend to appreciate them more.
