Random Walks - Sign Change Paradox
.Purpose
Investigate Sign changes in random walks.
> test <- function(M) {
+     N <- 10000
+     realizations <- matrix(data = sign(rnorm(M * N)), ncol = N)
+     results <- vector()
+     results <- vector()
+     i <- 1
+     for (i in seq_along(realizations[1, ])) {
+         x <- (cumsum((realizations[, i])))
+         zcts <- 0
+         indices <- array(which(x == 0))
+         if (length(indices) > 0) {
+             for (j in 1:length(indices)) {
+                 if (indices[j] < M) {
+                   if (x[indices[j] - 1] * x[indices[j] + 1] <
+                     1) {
+                     zcts <- zcts + 1
+                   }
+                 }
+             }
+         }
+         results <- c(results, zcts)
+     }
+     results
+ } |
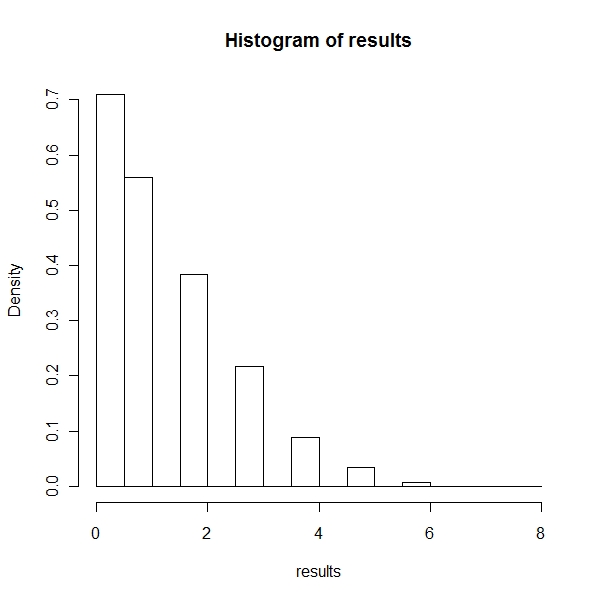
> results <- test(19) > hist(results, prob = T) > mean(results) [1] 1.271 |
> results <- test(59) > hist(results, prob = T) > mean(results) [1] 2.5856 |
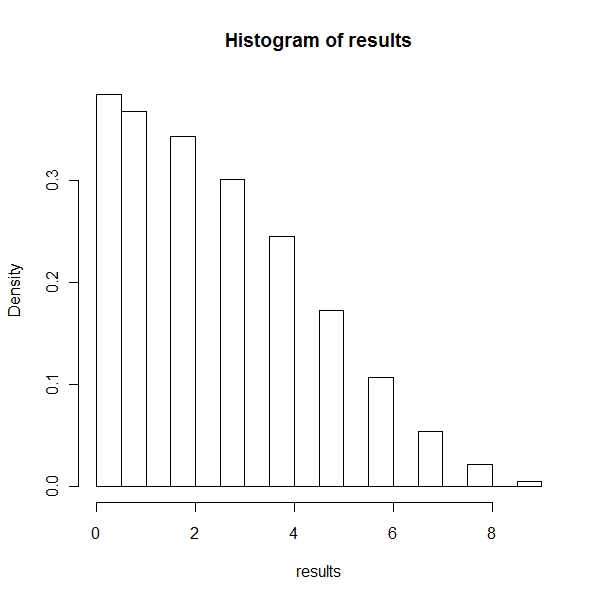
> results <- test(99) > hist(results, prob = T) > mean(results) [1] 3.476 |
As it clearly evident, for T = 19, 59, 99 , the expected number of sign changes = 1.2786, 2.5723 , 3.5375
> results <- test(100) > median(results) [1] 3 |

> test <- function(M) {
+     N <- 10000
+     realizations <- matrix(data = sign(rnorm(M * N)), ncol = N)
+     results <- vector()
+     results <- vector()
+     i <- 1
+     for (i in seq_along(realizations[1, ])) {
+         x <- (cumsum((realizations[, i])))
+         zcts <- length(which(x == 0))
+         results <- c(results, zcts)
+     }
+     results
+ } |
> results <- test(19) > hist(results, prob = T) > mean(results) [1] 2.5474 |
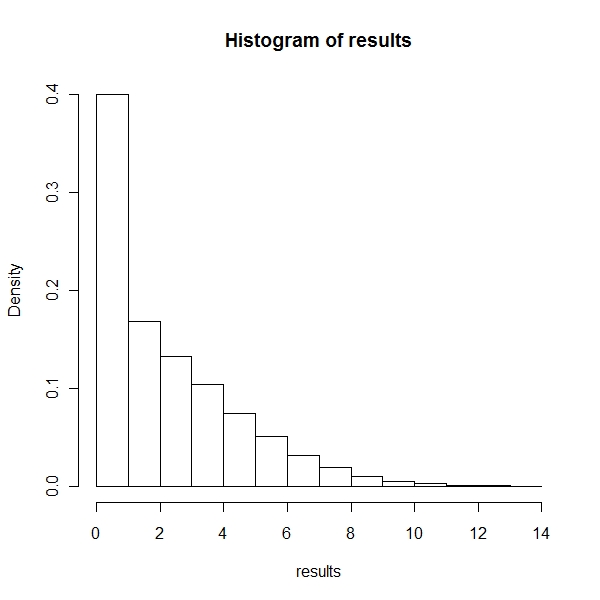
> results <- test(59) > hist(results, prob = T) > mean(results) [1] 5.1361 |
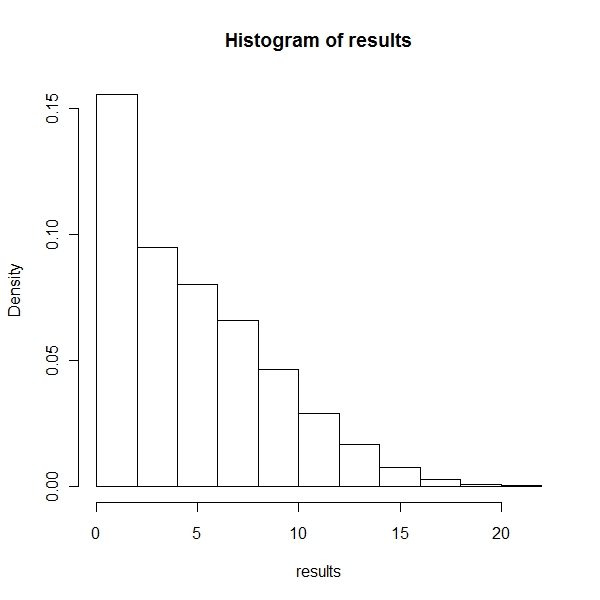
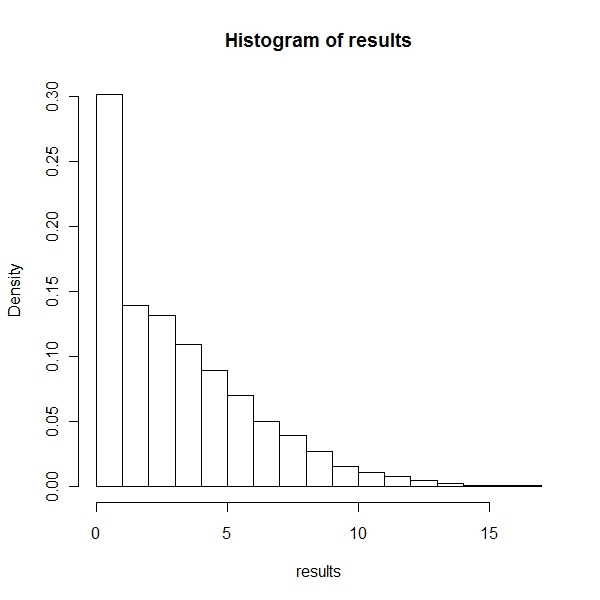
> results <- test(99) > hist(results, prob = T) > mean(results) [1] 6.9908 |
As it clearly evident, for T = 19, 59, 99 , the expected number of sign changes = 2.5727, 5.199 , 6.9048
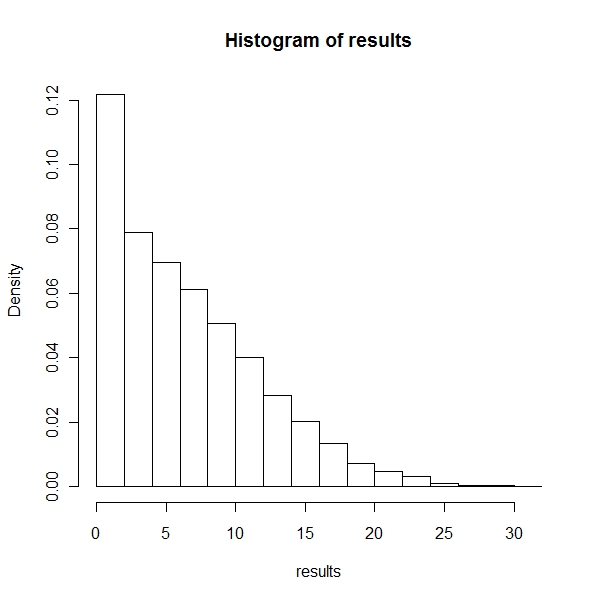
For 100 tosses
> results <- test(100) > median(results) [1] 6 > mean(results) [1] 7.0449 |

So, you got to understand that the frequency of sign changes goes down drastically for a random walk. For about 100 trials the median crossings = 3 and median crossings and reflections is about 7