RandomWalk
.Purpose
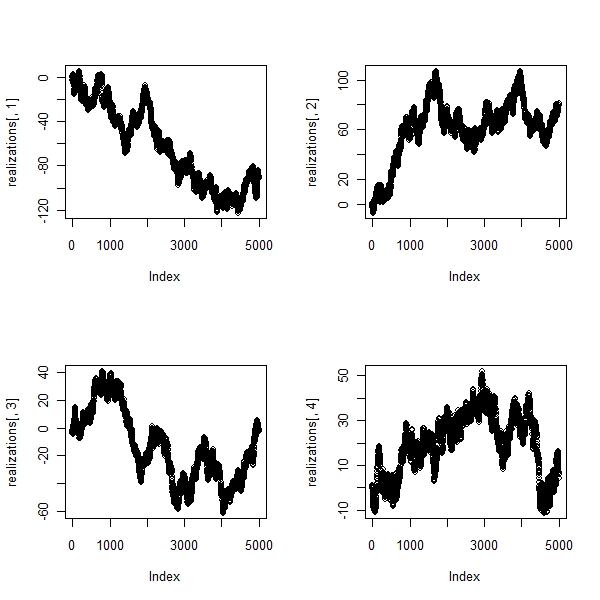
Simulate 5000 sample paths , 4 times and report the stats
> set.seed(1977)
> n <- 5000
> realizations <- matrix(data = NA, ncol = 4, nrow = n)
> outcomes <- matrix(data = rnorm(4 * n), nrow = n, ncol = 4)
> for (i in 1:4) realizations[, i] <- cumsum(outcomes[, i])
> f1 <- function(x) {
+     length(which(x > 0))/length(x)
+ }
> f2 <- function(x) {
+     length(which(x < 0))/length(x)
+ }
> f3 <- function(x) {
+     length(which(x == 0))/length(x)
+ }
> f4 <- function(x) {
+     length(which(x[1:(n - 1)] * x[2:n] < 0))/length(x)
+ }
> f5 <- function(x) {
+     y <- ifelse(sign(x) < 0, 0, sign(x))
+     zeroes <- which(y == 0)
+     zeroes <- c(head(zeroes, 1) - 1, zeroes, 25 - tail(zeroes,
+         1))
+     max(diff(zeroes))/length(x)
+ }
> res <- function(x, y) {
+     a <- f1(x)
+     b <- f2(x)
+     c <- f1(y)
+     d <- f3(y)
+     e <- f2(y)
+     f <- f4(y)
+     g <- f5(y)
+     c(a, b, c, d, e, f, g) * 100
+ }
> results <- data.frame(sim1 = res(outcomes[, 1], realizations[,
+     1]), sim2 = res(outcomes[, 2], realizations[, 2]), sim3 = res(outcomes[,
+     3], realizations[, 3]), sim4 = res(outcomes[, 4], realizations[,
+     4]))
> rownames(results) <- c("Prop(+)perct", "Prop(-)perct", "Prop(St>0)perct",
+     "Prop(St=0)perct", "Prop(St<0)perct", "Prop(ChangeSign)perct",
+ "Prop(MaxSeq)perct") |
Results are not really intuitive. After all random might not be really random.
> par(mfrow = c(2, 2)) > plot(realizations[, 1]) > plot(realizations[, 2]) > plot(realizations[, 3]) > plot(realizations[, 4]) |
> print(results)
                       sim1  sim2  sim3  sim4
Prop(+)perct          50.34 50.64 50.44 50.80
Prop(-)perct          49.66 49.36 49.56 49.20
Prop(St>0)perct        1.40 99.14 29.42 88.20
Prop(St=0)perct        0.00  0.00  0.00  0.00
Prop(St<0)perct       98.60  0.86 70.58 11.80
Prop(ChangeSign)perct  0.56  0.12  0.76  1.44
Prop(MaxSeq)perct 0.40 0.20 25.32 75.74 |