John Fox Applied Reg - Chap 7
.Purpose Graphs for DB from Fox
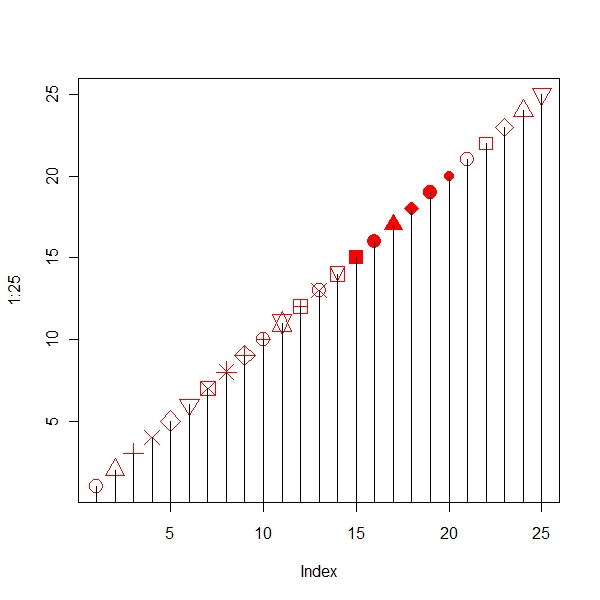
> plot(1:25, pch = 1:25, cex = 2, col = "red") > lines(1:25, type = "h") |
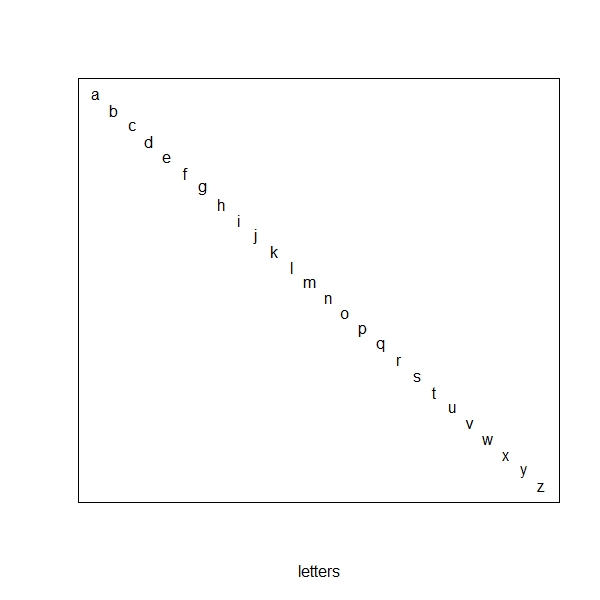
> plot(1:26, xlab = "letters", ylab = "", type = "n", axes = F)
> box()
> for (i in 1:26) {
+     points(i, 27 - i, pch = letters[i])
+ } |
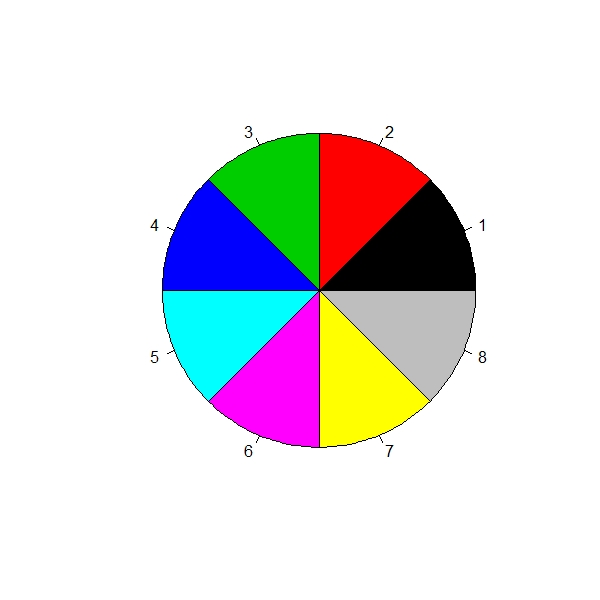
palette function - Specify colors using palette
> pie(rep(1, length(palette())), col = palette()) |
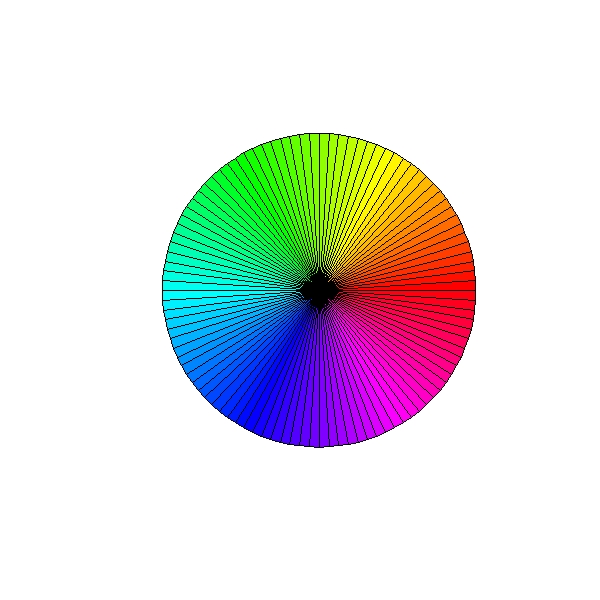
rainbow function - Specify colors using rainbow function
> pie(rep(1, 100), col = rainbow(100), labels = rep("", 100)) |
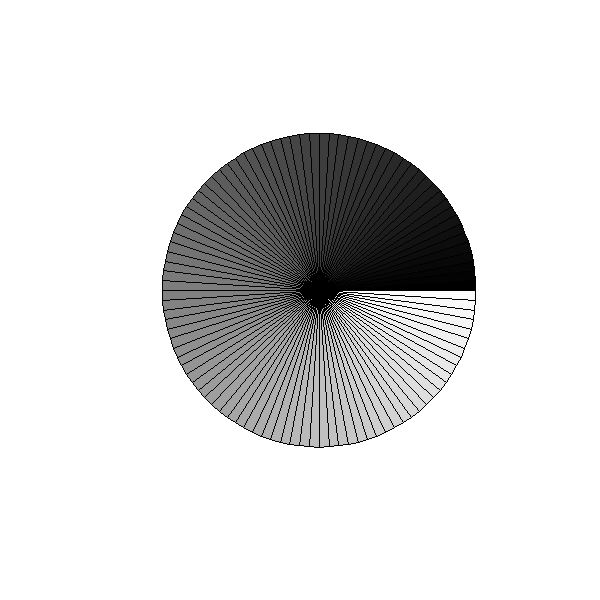
gray function - Specify colors using gray function
> pie(rep(1, 100), col = gray(0:100/100), labels = rep("", 100)) |
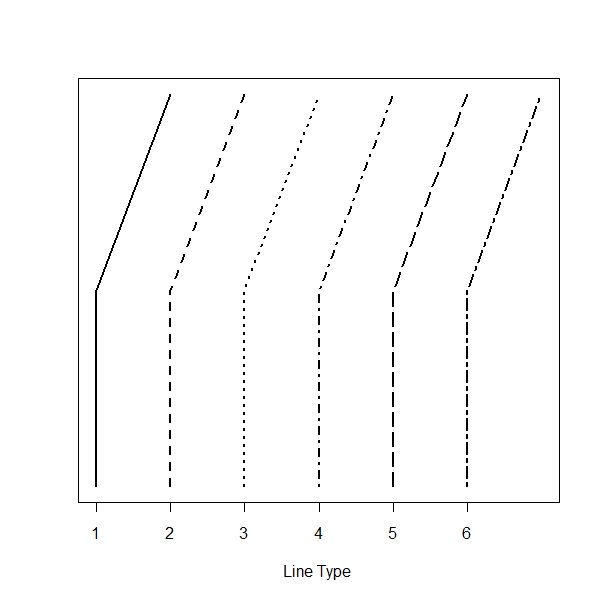
lty - Different type of lty’s present
> plot(c(1, 7), c(0, 1), type = "n", axes = F, xlab = "Line Type ",
+     ylab = "")
> box()
> axis(1, 1:6)
> for (i in 1:6) {
+     lines(c(i, i, i + 1), c(0, 0.5, 1), lty = i, lwd = 2)
+ } |
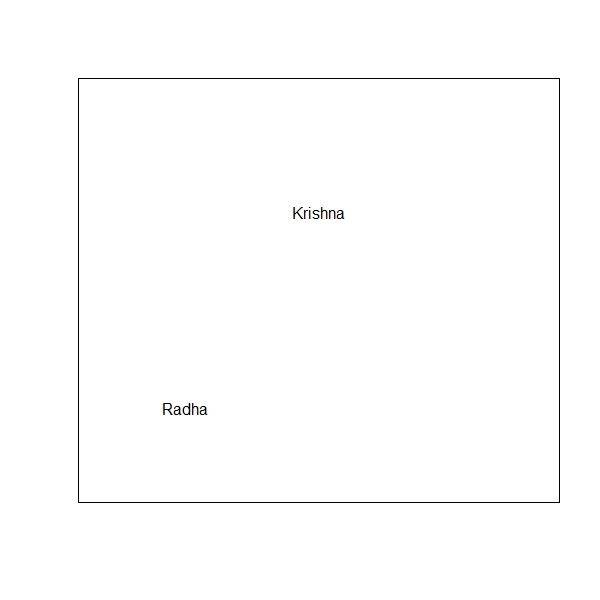
- adding text generally
> plot(c(0, 1), c(0, 1), axes = F, type = "n", xlab = "", ylab = "")
> box()
> text(x = c(0.2, 0.5), y = c(0.2, 0.7), c("Radha", "Krishna")) |
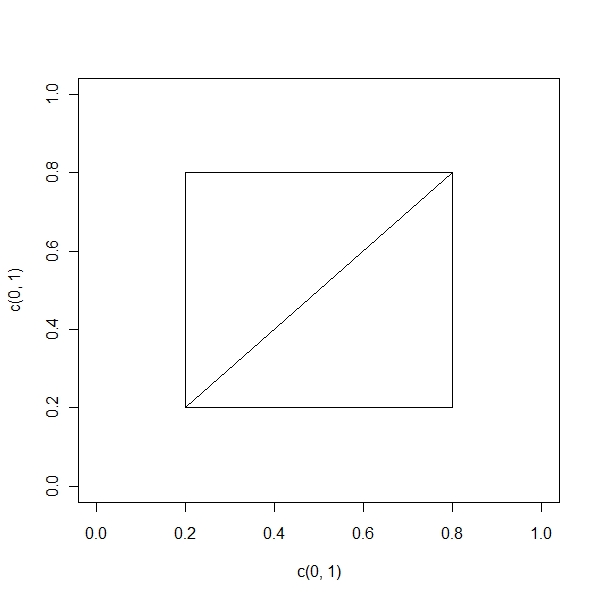
drawing a triangle
> plot(c(0, 1), c(0, 1), axes = F, type = "n") > box() > axis(1, seq(0, 1, 0.2)) > axis(2, seq(0, 1, 0.2)) > lines(c(0.2, 0.2, 0.8, 0.8, 0.2), c(0.2, 0.8, 0.8, 0.2, 0.2)) > segments(0.2, 0.2, 0.8, 0.8, col = "black") |
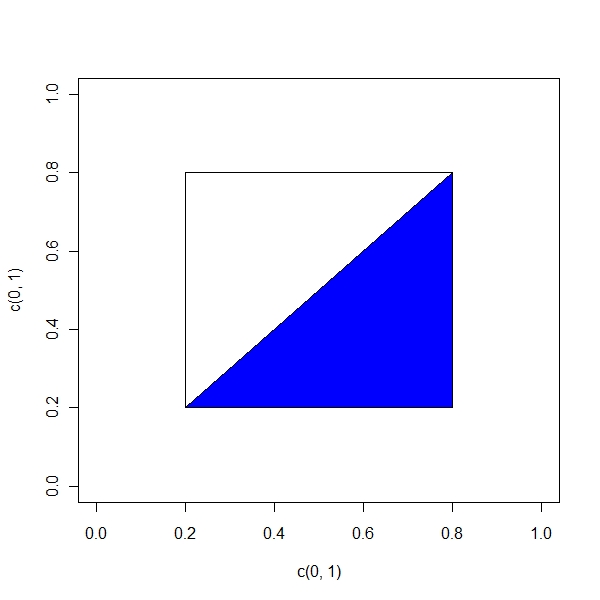
drawing a triangle and filling a color
> plot(c(0, 1), c(0, 1), axes = F, type = "n") > box() > axis(1, seq(0, 1, 0.2)) > axis(2, seq(0, 1, 0.2)) > lines(c(0.2, 0.2, 0.8, 0.8, 0.2), c(0.2, 0.8, 0.8, 0.2, 0.2)) > polygon(c(0.2, 0.8, 0.8), c(0.2, 0.8, 0.2), col = "blue") |

drawing a triangle and filling a color
> plot(c(0, 1), c(0, 1), axes = F, type = "n") > box() > axis(1, seq(0, 1, 0.2)) > axis(2, seq(0, 1, 0.2)) > polygon(c(0.2, 0.2, 0.8, 0.8, 0.2), c(0.2, 0.8, 0.8, 0.2, 0.2)) > polygon(c(0.2, 0.8, 0.8), c(0.2, 0.8, 0.2), col = "blue") |
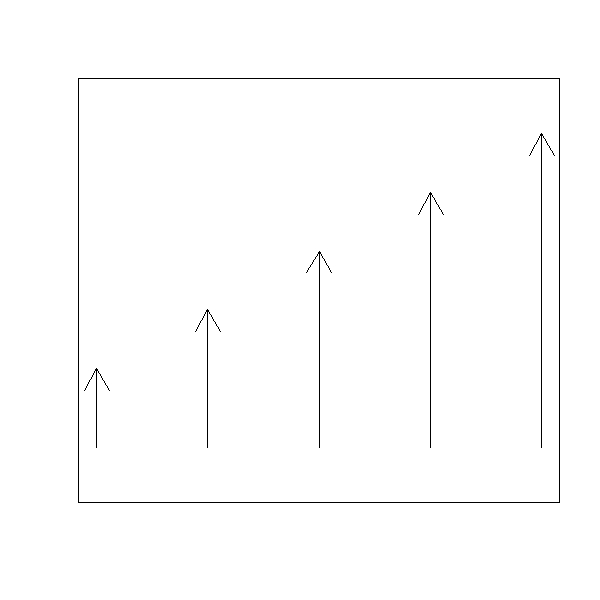
lines
> plot(c(1, 5), c(0, 1), axes = F, type = "n", xlab = "", ylab = "") > box() > arrows(x0 = 1:5, y0 = rep(0.1, 5), x1 = 1:5, y1 = seq(0.3, 0.9, + len = 5)) |
segments
> plot(c(1, 5), c(0, 1), axes = F, type = "n", xlab = "", ylab = "") > box() > segments(x0 = 1:5, y0 = rep(0.1, 5), x1 = 1:5, y1 = seq(0.3, + 0.9, len = 5)) |
