Distributions- Chap 4
Purpose
Estimation of GLM from Annette Hobson’s book
Data Preparation
> setwd("C:/Cauldron/garage/R/soulcraft/Volatility/Learn/Dobson-GLM")
> x <- read.csv("test6.csv", header = T, stringsAsFactors = F)
> hist(x[, 1], col = "blue", breaks = seq(0, 18000, 1000)) |
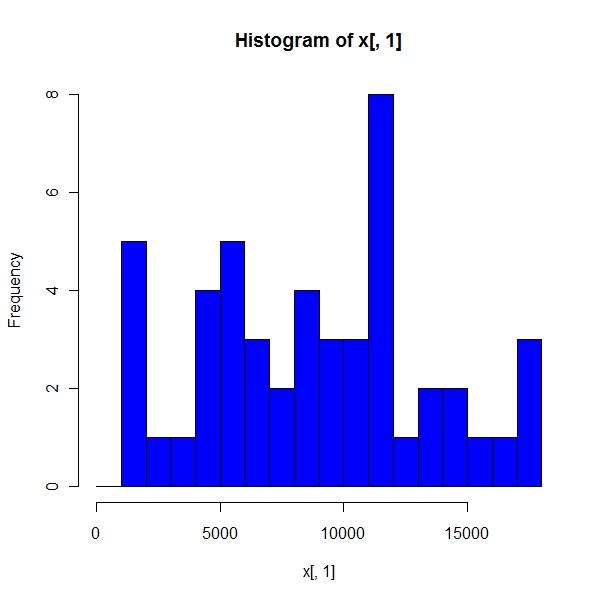
> setwd("C:/Cauldron/garage/R/soulcraft/Volatility/Learn/Dobson-GLM")
> x <- read.csv("test6.csv", header = T, stringsAsFactors = F)
> hist(x[, 1], col = "blue", breaks = seq(0, 18000, 1000)) |

Fitting Weibull in R
> z <- fitdistr(x[, 1], "weibull")
> print(z)
      shape          scale
  2.039199e+00   1.020161e+04
(2.392952e-01) (7.653752e+02) |
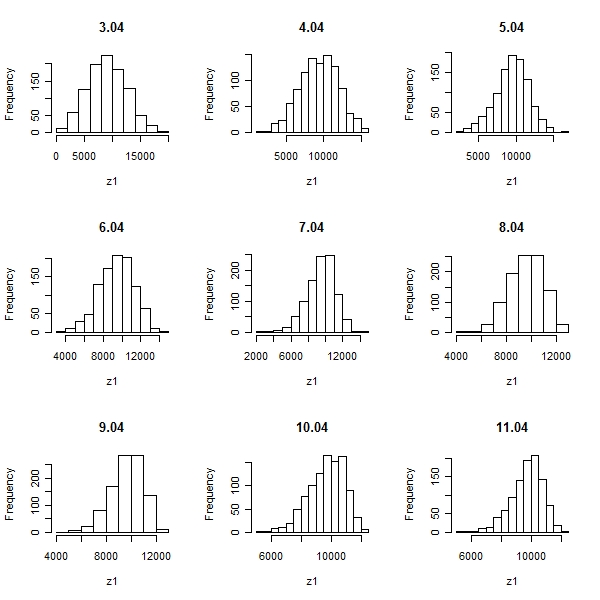
For shape parameter with 3 to 11
> par(mfrow = c(3, 3))
> for (i in 1:9) {
+     z1 <- rweibull(1000, z$estimate[1] + i, z$estimate[2])
+     hist(z1, main = round(z$estimate[1] + i, 2))
+ } |
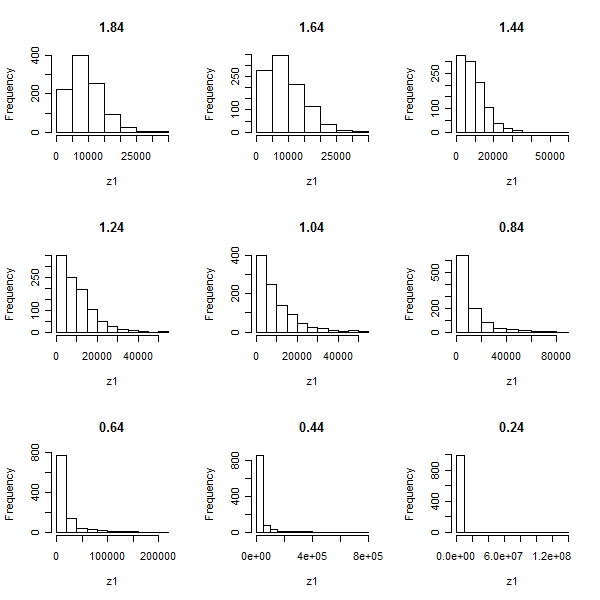
For shape parameter close to 2 to 0
> par(mfrow = c(3, 3))
> for (i in 1:9) {
+     z1 <- rweibull(1000, z$estimate[1] - i * 0.2, z$estimate[2])
+     hist(z1, main = round(z$estimate[1] - i * 0.2, 2))
+ } |