WPI Growth
Purpose
Check WPI numbers
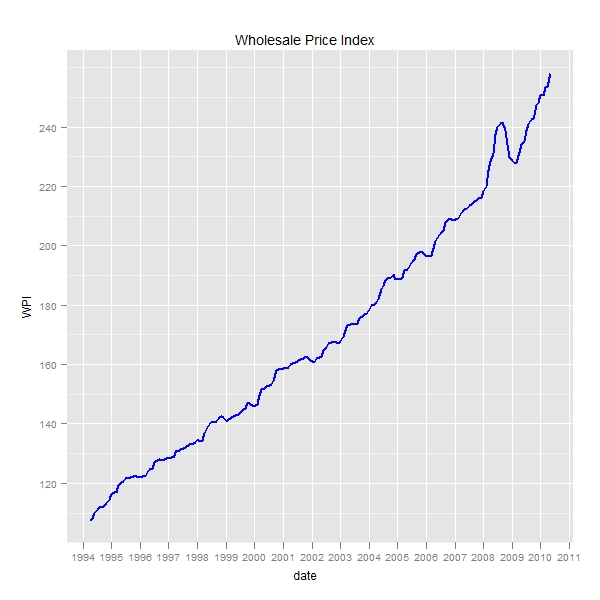
Plotting the raw WPI
> library(ggplot2)
> file <- "C:/Cauldron/Benchmark/PMS/LifeCycleFund/wpi.csv"
> wpi <- read.csv(file, header = T, stringsAsFactors = F)
> wpi$date <- as.Date(wpi$Date, format = "%d-%m-%Y")
> wpi <- wpi[, c("date", "WPI")]
> p <- ggplot(wpi, aes(x = date, y = WPI)) + scale_x_date()
> q <- p + geom_line(colour = "blue", lwd = 0.9)
> q <- q + scale_x_date(major = "years")
> q <- q + scale_y_continuous("WPI")
> q <- q + opts(title = "Wholesale Price Index")
> print(q) |
Plotting the annualized wpi growth rate
> annualized.returns <- function(x) {
+     n <- length(x)
+     (x[n] - x[1])/x[1]
+ }
> wpi.xts <- xts(wpi$WPI, wpi$date)
> wpi.roll <- rollapply(wpi.xts[, 1], width = 13, annualized.returns,
+     align = "right")
> wpi.roll.df <- as.data.frame(wpi.roll)
> wpi.roll.df$date <- as.Date(rownames(wpi.roll.df))
> p <- ggplot(wpi.roll.df, aes(x = date, y = wpi.roll * 100)) +
+     scale_x_date()
> q <- p + geom_line(colour = "blue", lwd = 0.9)
> q <- q + scale_x_date(major = "years")
> q <- q + scale_y_continuous(" Growth Rate")
> q <- q + opts(title = "Wholesale Price Index")
> print(q)
> median(wpi.roll.df[, 1])
[1] 0.05122276 |
The median for the growth rates is about 5.12 percent
If inflation is about 5.12 percent , then it takes about 5 years to reduce your net worth by 25 percent. This has to be factored in the investments.